

132
4 Climate Mitigation and India’s Commitment to Global Community
0 1000 2000 3000 4000 5000 6000 7000 8000 9000 10000
Production of carbon black
Land use, Land-use change and Forestry
Transport
Industrial waste water
Agricultural crop residue
Domestic waste water
Municipal solid waste disposal
Oil and natural gas
Coal Mining
Manure management
Biomass burning
Rice cultivation
Enteric fermentation
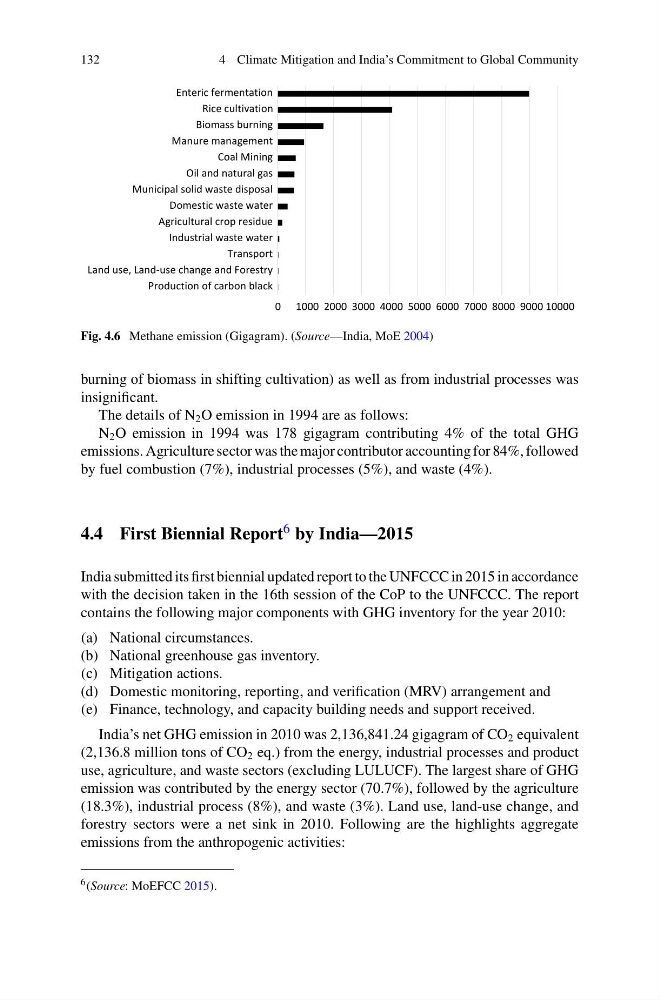
Fig. 4.6 Methane emission (Gigagram). (Source—India, MoE 2004)
burning of biomass in shifting cultivation) as well as from industrial processes was
insignificant.
The details of N 2 O emission in 1994 are as follows:
N 2 O emission in 1994 was 178 gigagram contributing 4% of the total GHG
emissions. Agriculture sector was the major contributor accounting for 84%, followed
by fuel combustion (7%), industrial processes (5%), and waste (4%).
4.4 First Biennial Report 6 by India—2015
India submitted its first biennial updated report to the UNFCCC in 2015 in accordance
with the decision taken in the 16th session of the CoP to the UNFCCC. The report
contains the following major components with GHG inventory for the year 2010:
(a) National circumstances.
(b) National greenhouse gas inventory.
(c) Mitigation actions.
(d) Domestic monitoring, reporting, and verification (MRV) arrangement and
(e) Finance, technology, and capacity building needs and support received.
India’s net GHG emission in 2010 was 2,136,841.24 gigagram of CO 2 equivalent
(2,136.8 million tons of CO 2 eq.) from the energy, industrial processes and product
use, agriculture, and waste sectors (excluding LULUCF). The largest share of GHG
emission was contributed by the energy sector (70.7%), followed by the agriculture
(18.3%), industrial process (8%), and waste (3%). Land use, land-use change, and
forestry sectors were a net sink in 2010. Following are the highlights aggregate
emissions from the anthropogenic activities:
6 (Source: MoEFCC 2015).
4 Climate Mitigation and India’s Commitment to Global Community
0 1000 2000 3000 4000 5000 6000 7000 8000 9000 10000
Production of carbon black
Land use, Land-use change and Forestry
Transport
Industrial waste water
Agricultural crop residue
Domestic waste water
Municipal solid waste disposal
Oil and natural gas
Coal Mining
Manure management
Biomass burning
Rice cultivation
Enteric fermentation
Fig. 4.6 Methane emission (Gigagram). (Source—India, MoE 2004)
burning of biomass in shifting cultivation) as well as from industrial processes was
insignificant.
The details of N 2 O emission in 1994 are as follows:
N 2 O emission in 1994 was 178 gigagram contributing 4% of the total GHG
emissions. Agriculture sector was the major contributor accounting for 84%, followed
by fuel combustion (7%), industrial processes (5%), and waste (4%).
4.4 First Biennial Report 6 by India—2015
India submitted its first biennial updated report to the UNFCCC in 2015 in accordance
with the decision taken in the 16th session of the CoP to the UNFCCC. The report
contains the following major components with GHG inventory for the year 2010:
(a) National circumstances.
(b) National greenhouse gas inventory.
(c) Mitigation actions.
(d) Domestic monitoring, reporting, and verification (MRV) arrangement and
(e) Finance, technology, and capacity building needs and support received.
India’s net GHG emission in 2010 was 2,136,841.24 gigagram of CO 2 equivalent
(2,136.8 million tons of CO 2 eq.) from the energy, industrial processes and product
use, agriculture, and waste sectors (excluding LULUCF). The largest share of GHG
emission was contributed by the energy sector (70.7%), followed by the agriculture
(18.3%), industrial process (8%), and waste (3%). Land use, land-use change, and
forestry sectors were a net sink in 2010. Following are the highlights aggregate
emissions from the anthropogenic activities:
6 (Source: MoEFCC 2015).