

4.4 First Biennial Report by India—2015
133
1574362.14
1632623.84
0
314586.77
TOTAL without LULUCF (Gg)
TOTAL with LULUCF (Gg)
Carbon dioxide emission
Carbon dioxide removal
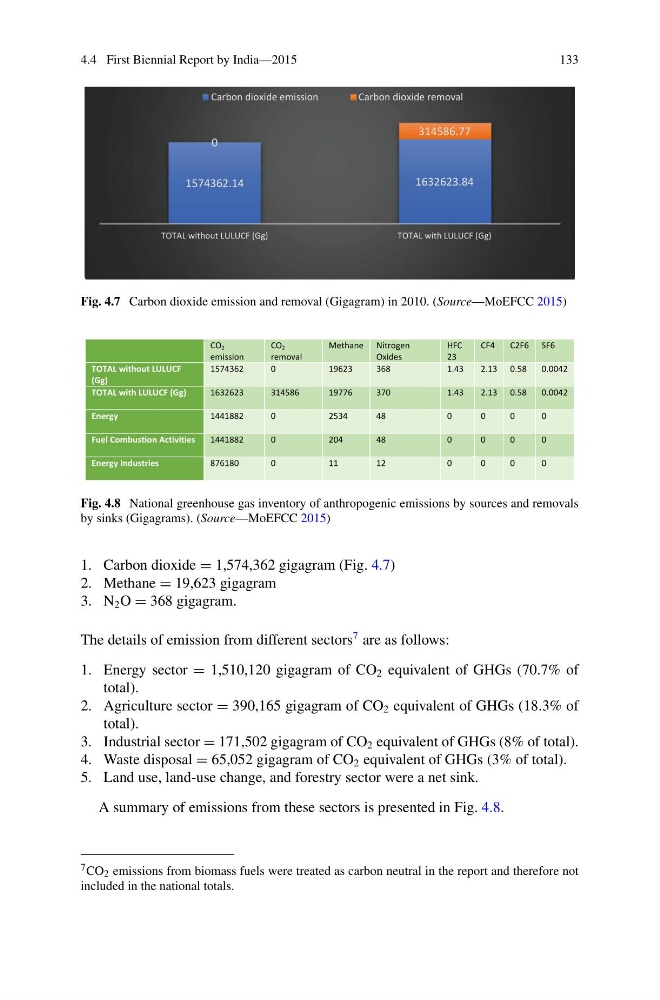
Fig. 4.7 Carbon dioxide emission and removal (Gigagram) in 2010. (Source—MoEFCC 2015)
CO2
emission
CO2
removal
Methane Nitrogen
Oxides
HFC
23
CF4
C2F6 SF6
TOTAL without LULUCF
(Gg)
1574362
0
19623
368
1.43
2.13 0.58
0.0042
TOTAL with LULUCF (Gg)
1632623
314586
19776
370
1.43
2.13 0.58
0.0042
Energy
1441882
0
2534
48
0
0
0
0
Fuel Combustion Activities
1441882
0
204
48
0
0
0
0
Energy Industries
876180
0
11
12
0
0
0
0
Fig. 4.8 National greenhouse gas inventory of anthropogenic emissions by sources and removals
by sinks (Gigagrams). (Source—MoEFCC 2015)
1. Carbon dioxide = 1,574,362 gigagram (Fig. 4.7)
2. Methane = 19,623 gigagram
3. N 2 O = 368 gigagram.
The details of emission from different sectors
7 are as follows:
1. Energy sector = 1,510,120 gigagram of CO 2 equivalent of GHGs (70.7% of
total).
2. Agriculture sector = 390,165 gigagram of CO 2 equivalent of GHGs (18.3% of
total).
3. Industrial sector = 171,502 gigagram of CO 2 equivalent of GHGs (8% of total).
4. Waste disposal = 65,052 gigagram of CO 2 equivalent of GHGs (3% of total).
5. Land use, land-use change, and forestry sector were a net sink.
A summary of emissions from these sectors is presented in Fig. 4.8.
7 CO 2 emissions from biomass fuels were treated as carbon neutral in the report and therefore not
included in the national totals.
133
1574362.14
1632623.84
0
314586.77
TOTAL without LULUCF (Gg)
TOTAL with LULUCF (Gg)
Carbon dioxide emission
Carbon dioxide removal
Fig. 4.7 Carbon dioxide emission and removal (Gigagram) in 2010. (Source—MoEFCC 2015)
CO2
emission
CO2
removal
Methane Nitrogen
Oxides
HFC
23
CF4
C2F6 SF6
TOTAL without LULUCF
(Gg)
1574362
0
19623
368
1.43
2.13 0.58
0.0042
TOTAL with LULUCF (Gg)
1632623
314586
19776
370
1.43
2.13 0.58
0.0042
Energy
1441882
0
2534
48
0
0
0
0
Fuel Combustion Activities
1441882
0
204
48
0
0
0
0
Energy Industries
876180
0
11
12
0
0
0
0
Fig. 4.8 National greenhouse gas inventory of anthropogenic emissions by sources and removals
by sinks (Gigagrams). (Source—MoEFCC 2015)
1. Carbon dioxide = 1,574,362 gigagram (Fig. 4.7)
2. Methane = 19,623 gigagram
3. N 2 O = 368 gigagram.
The details of emission from different sectors
7 are as follows:
1. Energy sector = 1,510,120 gigagram of CO 2 equivalent of GHGs (70.7% of
total).
2. Agriculture sector = 390,165 gigagram of CO 2 equivalent of GHGs (18.3% of
total).
3. Industrial sector = 171,502 gigagram of CO 2 equivalent of GHGs (8% of total).
4. Waste disposal = 65,052 gigagram of CO 2 equivalent of GHGs (3% of total).
5. Land use, land-use change, and forestry sector were a net sink.
A summary of emissions from these sectors is presented in Fig. 4.8.
7 CO 2 emissions from biomass fuels were treated as carbon neutral in the report and therefore not
included in the national totals.