

128
4 Climate Mitigation and India’s Commitment to Global Community
0
100
200
300
400
500
600
700
800
900
Coal (Million ton)
Lignite (Million ton)
Crude Oil (Million ton)
Natural Gas (Billion Cubic Metre)
1960-1961
1970-1971
1980-1981
1990-1991
2001-2002
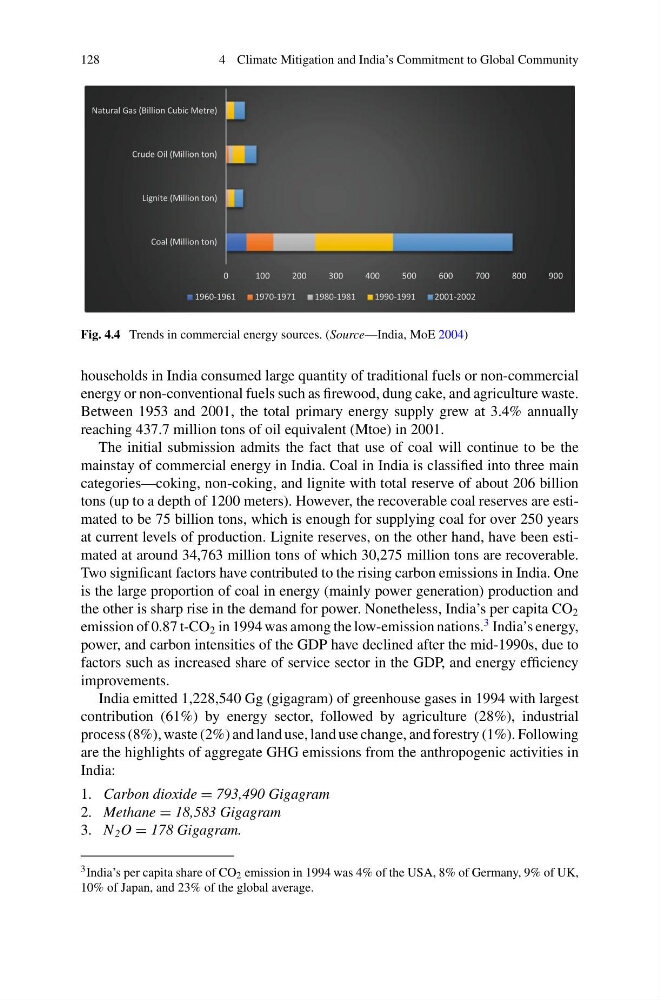
Fig. 4.4 Trends in commercial energy sources. (Source—India, MoE 2004)
households in India consumed large quantity of traditional fuels or non-commercial
energy or non-conventional fuels such as firewood, dung cake, and agriculture waste.
Between 1953 and 2001, the total primary energy supply grew at 3.4% annually
reaching 437.7 million tons of oil equivalent (Mtoe) in 2001.
The initial submission admits the fact that use of coal will continue to be the
mainstay of commercial energy in India. Coal in India is classified into three main
categories—coking, non-coking, and lignite with total reserve of about 206 billion
tons (up to a depth of 1200 meters). However, the recoverable coal reserves are estimated to be 75 billion tons, which is enough for supplying coal for over 250 years
at current levels of production. Lignite reserves, on the other hand, have been estimated at around 34,763 million tons of which 30,275 million tons are recoverable.
Two significant factors have contributed to the rising carbon emissions in India. One
is the large proportion of coal in energy (mainly power generation) production and
the other is sharp rise in the demand for power. Nonetheless, India’s per capita CO 2
emission of 0.87 t-CO 2 in 1994 was among the low-emission nations.
3 India’s energy,
power, and carbon intensities of the GDP have declined after the mid-1990s, due to
factors such as increased share of service sector in the GDP, and energy efficiency
improvements.
India emitted 1,228,540 Gg (gigagram) of greenhouse gases in 1994 with largest
contribution (61%) by energy sector, followed by agriculture (28%), industrial
process (8%), waste (2%) and land use, land use change, and forestry (1%). Following
are the highlights of aggregate GHG emissions from the anthropogenic activities in
India:
1. Carbon dioxide = 793,490 Gigagram
2. Methane = 18,583 Gigagram
3. N 2 O = 178 Gigagram.
3 India’s per capita share of CO 2 emission in 1994 was 4% of the USA, 8% of Germany, 9% of UK,
10% of Japan, and 23% of the global average.
4 Climate Mitigation and India’s Commitment to Global Community
0
100
200
300
400
500
600
700
800
900
Coal (Million ton)
Lignite (Million ton)
Crude Oil (Million ton)
Natural Gas (Billion Cubic Metre)
1960-1961
1970-1971
1980-1981
1990-1991
2001-2002
Fig. 4.4 Trends in commercial energy sources. (Source—India, MoE 2004)
households in India consumed large quantity of traditional fuels or non-commercial
energy or non-conventional fuels such as firewood, dung cake, and agriculture waste.
Between 1953 and 2001, the total primary energy supply grew at 3.4% annually
reaching 437.7 million tons of oil equivalent (Mtoe) in 2001.
The initial submission admits the fact that use of coal will continue to be the
mainstay of commercial energy in India. Coal in India is classified into three main
categories—coking, non-coking, and lignite with total reserve of about 206 billion
tons (up to a depth of 1200 meters). However, the recoverable coal reserves are estimated to be 75 billion tons, which is enough for supplying coal for over 250 years
at current levels of production. Lignite reserves, on the other hand, have been estimated at around 34,763 million tons of which 30,275 million tons are recoverable.
Two significant factors have contributed to the rising carbon emissions in India. One
is the large proportion of coal in energy (mainly power generation) production and
the other is sharp rise in the demand for power. Nonetheless, India’s per capita CO 2
emission of 0.87 t-CO 2 in 1994 was among the low-emission nations.
3 India’s energy,
power, and carbon intensities of the GDP have declined after the mid-1990s, due to
factors such as increased share of service sector in the GDP, and energy efficiency
improvements.
India emitted 1,228,540 Gg (gigagram) of greenhouse gases in 1994 with largest
contribution (61%) by energy sector, followed by agriculture (28%), industrial
process (8%), waste (2%) and land use, land use change, and forestry (1%). Following
are the highlights of aggregate GHG emissions from the anthropogenic activities in
India:
1. Carbon dioxide = 793,490 Gigagram
2. Methane = 18,583 Gigagram
3. N 2 O = 178 Gigagram.
3 India’s per capita share of CO 2 emission in 1994 was 4% of the USA, 8% of Germany, 9% of UK,
10% of Japan, and 23% of the global average.