

4.2 India’s Initial Submission to UNFCCC in 2004
127
Cement
Lime
Lime stone
and dolomite
Soda ash
Ammonia
Carbide
Iron and
steel
Ferro alloys Aluminium
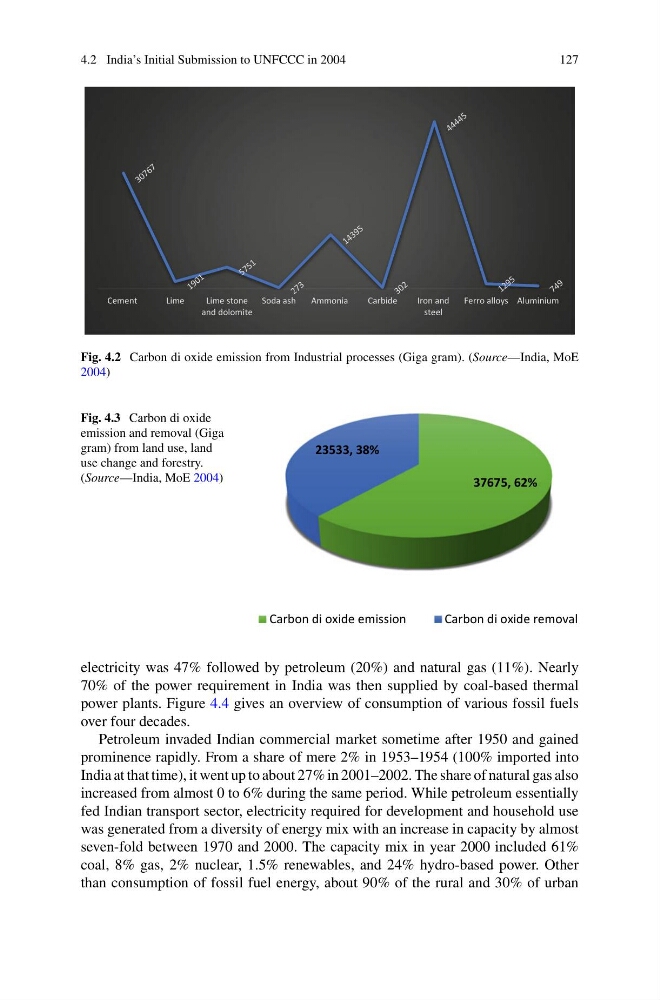
Fig. 4.2 Carbon di oxide emission from Industrial processes (Giga gram). (Source—India, MoE
2004)
Fig. 4.3 Carbon di oxide
emission and removal (Giga
gram) from land use, land
use change and forestry.
(Source—India, MoE 2004)
37675, 62%
23533, 38%
Carbon di oxide emission
Carbon di oxide removal
electricity was 47% followed by petroleum (20%) and natural gas (11%). Nearly
70% of the power requirement in India was then supplied by coal-based thermal
power plants. Figure 4.4 gives an overview of consumption of various fossil fuels
over four decades.
Petroleum invaded Indian commercial market sometime after 1950 and gained
prominence rapidly. From a share of mere 2% in 1953–1954 (100% imported into
India at that time), it went up to about 27% in 2001–2002. The share of natural gas also
increased from almost 0 to 6% during the same period. While petroleum essentially
fed Indian transport sector, electricity required for development and household use
was generated from a diversity of energy mix with an increase in capacity by almost
seven-fold between 1970 and 2000. The capacity mix in year 2000 included 61%
coal, 8% gas, 2% nuclear, 1.5% renewables, and 24% hydro-based power. Other
than consumption of fossil fuel energy, about 90% of the rural and 30% of urban
127
Cement
Lime
Lime stone
and dolomite
Soda ash
Ammonia
Carbide
Iron and
steel
Ferro alloys Aluminium
Fig. 4.2 Carbon di oxide emission from Industrial processes (Giga gram). (Source—India, MoE
2004)
Fig. 4.3 Carbon di oxide
emission and removal (Giga
gram) from land use, land
use change and forestry.
(Source—India, MoE 2004)
37675, 62%
23533, 38%
Carbon di oxide emission
Carbon di oxide removal
electricity was 47% followed by petroleum (20%) and natural gas (11%). Nearly
70% of the power requirement in India was then supplied by coal-based thermal
power plants. Figure 4.4 gives an overview of consumption of various fossil fuels
over four decades.
Petroleum invaded Indian commercial market sometime after 1950 and gained
prominence rapidly. From a share of mere 2% in 1953–1954 (100% imported into
India at that time), it went up to about 27% in 2001–2002. The share of natural gas also
increased from almost 0 to 6% during the same period. While petroleum essentially
fed Indian transport sector, electricity required for development and household use
was generated from a diversity of energy mix with an increase in capacity by almost
seven-fold between 1970 and 2000. The capacity mix in year 2000 included 61%
coal, 8% gas, 2% nuclear, 1.5% renewables, and 24% hydro-based power. Other
than consumption of fossil fuel energy, about 90% of the rural and 30% of urban