

104
3 The Challenges of Energy Supply
2,98,350.00
2,65,789.00
1,57,800.00
1,44,211.00
1,01,500.00
97,800.00
80,000.00
48,363.00
37,070.00
30,000.00
25,244.00
24,428.00
20,626.00
13,219.00
12,200.00
10,070.00
9,011.00
8,832.00
7,000.00
5,850.00
5,825.00
5,654.00
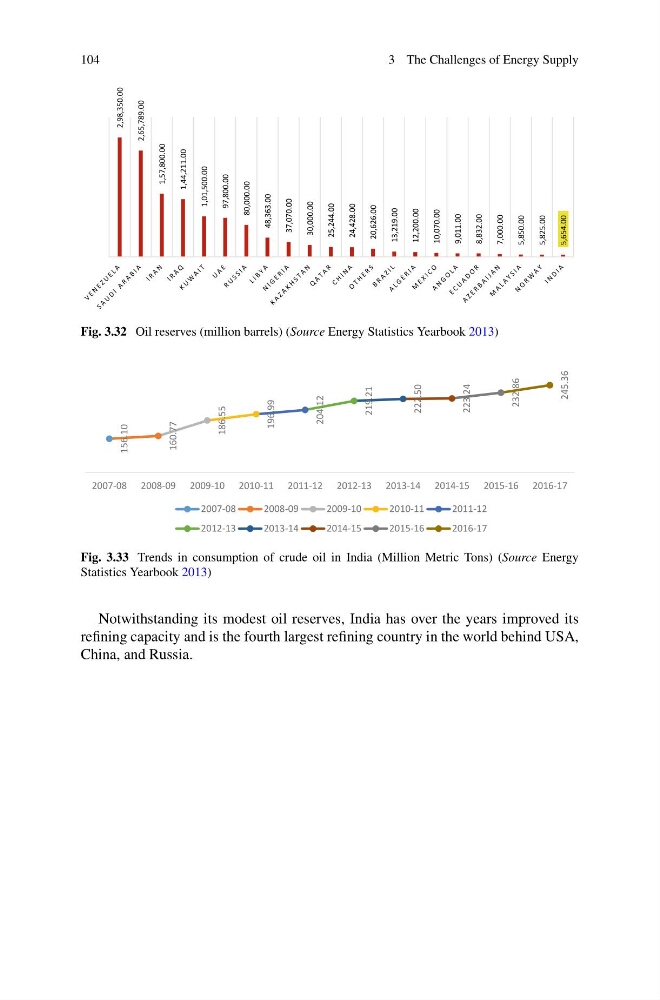
Fig. 3.32 Oil reserves (million barrels) (Source Energy Statistics Yearbook 2013)
156.10
160.77
186.55
196.99
204.12
219.21
222.50
223.24
232.86
245.36
2007-08 2008-09 2009-10 2010-11 2011-12 2012-13 2013-14 2014-15 2015-16 2016-17
2007-08
2008-09
2009-10
2010-11
2011-12
2012-13
2013-14
2014-15
2015-16
2016-17
Fig. 3.33 Trends in consumption of crude oil in India (Million Metric Tons) (Source Energy
Statistics Yearbook 2013)
Notwithstanding its modest oil reserves, India has over the years improved its
refining capacity and is the fourth largest refining country in the world behind USA,
China, and Russia.
3 The Challenges of Energy Supply
2,98,350.00
2,65,789.00
1,57,800.00
1,44,211.00
1,01,500.00
97,800.00
80,000.00
48,363.00
37,070.00
30,000.00
25,244.00
24,428.00
20,626.00
13,219.00
12,200.00
10,070.00
9,011.00
8,832.00
7,000.00
5,850.00
5,825.00
5,654.00
Fig. 3.32 Oil reserves (million barrels) (Source Energy Statistics Yearbook 2013)
156.10
160.77
186.55
196.99
204.12
219.21
222.50
223.24
232.86
245.36
2007-08 2008-09 2009-10 2010-11 2011-12 2012-13 2013-14 2014-15 2015-16 2016-17
2007-08
2008-09
2009-10
2010-11
2011-12
2012-13
2013-14
2014-15
2015-16
2016-17
Fig. 3.33 Trends in consumption of crude oil in India (Million Metric Tons) (Source Energy
Statistics Yearbook 2013)
Notwithstanding its modest oil reserves, India has over the years improved its
refining capacity and is the fourth largest refining country in the world behind USA,
China, and Russia.