

3 Percolation Toward Lateral Junctions
47
(c)
0.24
0.26
0.28
0.30
-200-150 -100 -50 0 50 100 150
FF
0
1
2
3
4
-200-150 -100 -50 0 50 100 150
J
sc / mAcm -2
(a)
(b)
0
0.1
0.2
0.3
0.4
0.5
-200-150 -100 -50 0 50 100 150
V
oc / V
0
0.1
0.2
0.3
0.4
0.5
-200 -150-100 -50 0 50 100 150
Temperature /
Efficiency / %
(d)
Temperature /
Temperature /
Temperature /
0.6
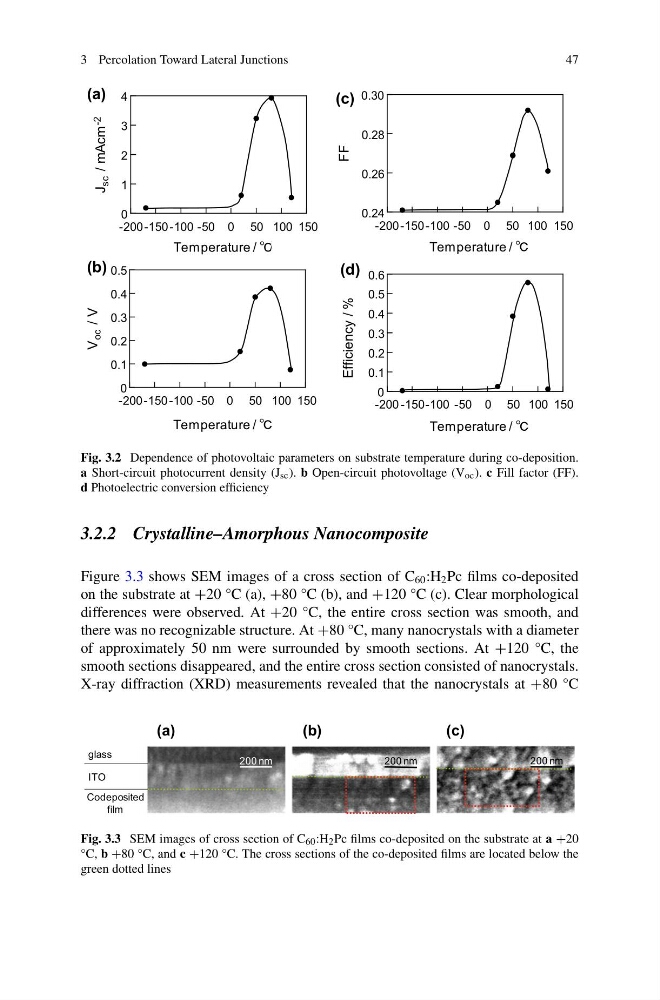
Fig. 3.2 Dependence of photovoltaic parameters on substrate temperature during co-deposition.
a Short-circuit photocurrent density (J sc ). b Open-circuit photovoltage (V oc ). c Fill factor (FF).
d Photoelectric conversion efficiency
3.2.2 Crystalline–Amorphous Nanocomposite
Figure 3.3 shows SEM images of a cross section of C 60 :H 2 Pc films co-deposited
on the substrate at +20 °C (a), +80 °C (b), and +120 °C (c). Clear morphological
differences were observed. At +20 °C, the entire cross section was smooth, and
there was no recognizable structure. At +80 °C, many nanocrystals with a diameter
of approximately 50 nm were surrounded by smooth sections. At +120 °C, the
smooth sections disappeared, and the entire cross section consisted of nanocrystals.
X-ray diffraction (XRD) measurements revealed that the nanocrystals at +80 °C
(a)
(b)
(c)
ITO
Codeposited
film
200 nm
200 nm
200 nm
glass
Fig. 3.3 SEM images of cross section of C 60 :H 2 Pc films co-deposited on the substrate at a +20
°C, b +80 °C, and c +120 °C. The cross sections of the co-deposited films are located below the
green dotted lines
47
(c)
0.24
0.26
0.28
0.30
-200-150 -100 -50 0 50 100 150
FF
0
1
2
3
4
-200-150 -100 -50 0 50 100 150
J
sc / mAcm -2
(a)
(b)
0
0.1
0.2
0.3
0.4
0.5
-200-150 -100 -50 0 50 100 150
V
oc / V
0
0.1
0.2
0.3
0.4
0.5
-200 -150-100 -50 0 50 100 150
Temperature /
Efficiency / %
(d)
Temperature /
Temperature /
Temperature /
0.6
Fig. 3.2 Dependence of photovoltaic parameters on substrate temperature during co-deposition.
a Short-circuit photocurrent density (J sc ). b Open-circuit photovoltage (V oc ). c Fill factor (FF).
d Photoelectric conversion efficiency
3.2.2 Crystalline–Amorphous Nanocomposite
Figure 3.3 shows SEM images of a cross section of C 60 :H 2 Pc films co-deposited
on the substrate at +20 °C (a), +80 °C (b), and +120 °C (c). Clear morphological
differences were observed. At +20 °C, the entire cross section was smooth, and
there was no recognizable structure. At +80 °C, many nanocrystals with a diameter
of approximately 50 nm were surrounded by smooth sections. At +120 °C, the
smooth sections disappeared, and the entire cross section consisted of nanocrystals.
X-ray diffraction (XRD) measurements revealed that the nanocrystals at +80 °C
(a)
(b)
(c)
ITO
Codeposited
film
200 nm
200 nm
200 nm
glass
Fig. 3.3 SEM images of cross section of C 60 :H 2 Pc films co-deposited on the substrate at a +20
°C, b +80 °C, and c +120 °C. The cross sections of the co-deposited films are located below the
green dotted lines