

2 A Path to the Blended Junction
37
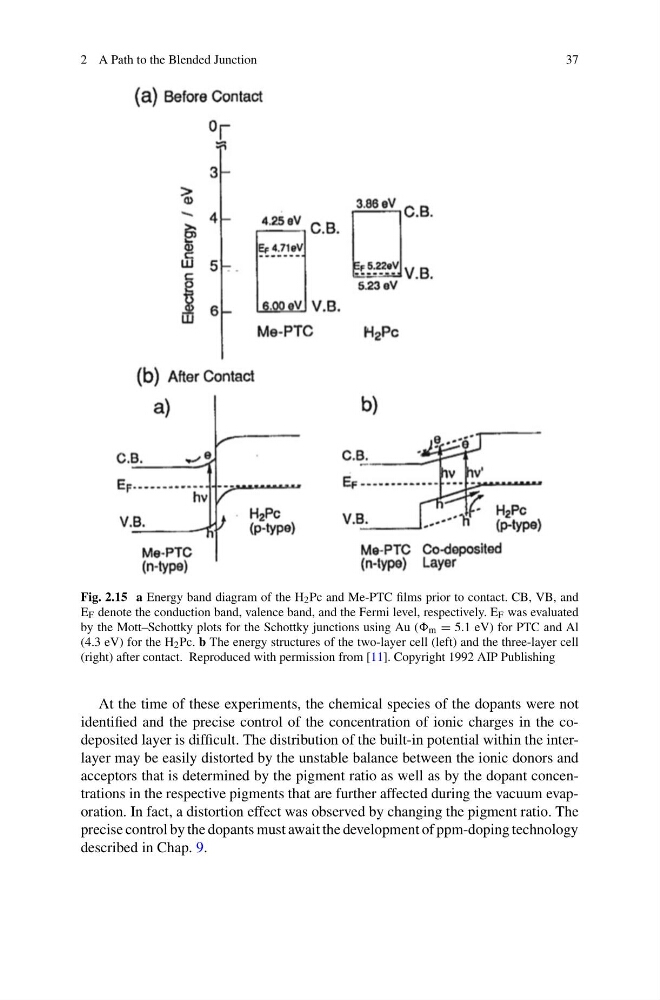
Fig. 2.15 a Energy band diagram of the H 2 Pc and Me-PTC films prior to contact. CB, VB, and
E F denote the conduction band, valence band, and the Fermi level, respectively. E F was evaluated
by the Mott–Schottky plots for the Schottky junctions using Au ( m = 5.1 eV) for PTC and Al
(4.3 eV) for the H 2 Pc. b The energy structures of the two-layer cell (left) and the three-layer cell
(right) after contact. Reproduced with permission from [11]. Copyright 1992 AIP Publishing
At the time of these experiments, the chemical species of the dopants were not
identified and the precise control of the concentration of ionic charges in the codeposited layer is difficult. The distribution of the built-in potential within the interlayer may be easily distorted by the unstable balance between the ionic donors and
acceptors that is determined by the pigment ratio as well as by the dopant concentrations in the respective pigments that are further affected during the vacuum evaporation. In fact, a distortion effect was observed by changing the pigment ratio. The
precise control by the dopants must await the development of ppm-doping technology
described in Chap. 9.
37
Fig. 2.15 a Energy band diagram of the H 2 Pc and Me-PTC films prior to contact. CB, VB, and
E F denote the conduction band, valence band, and the Fermi level, respectively. E F was evaluated
by the Mott–Schottky plots for the Schottky junctions using Au ( m = 5.1 eV) for PTC and Al
(4.3 eV) for the H 2 Pc. b The energy structures of the two-layer cell (left) and the three-layer cell
(right) after contact. Reproduced with permission from [11]. Copyright 1992 AIP Publishing
At the time of these experiments, the chemical species of the dopants were not
identified and the precise control of the concentration of ionic charges in the codeposited layer is difficult. The distribution of the built-in potential within the interlayer may be easily distorted by the unstable balance between the ionic donors and
acceptors that is determined by the pigment ratio as well as by the dopant concentrations in the respective pigments that are further affected during the vacuum evaporation. In fact, a distortion effect was observed by changing the pigment ratio. The
precise control by the dopants must await the development of ppm-doping technology
described in Chap. 9.