

2 A Path to the Blended Junction
35
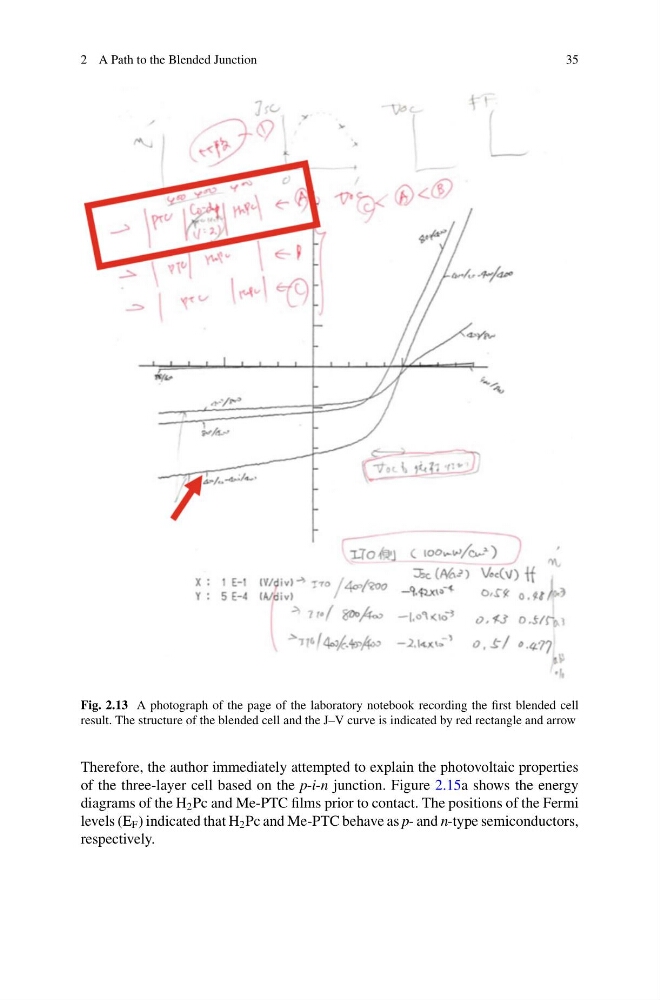
Fig. 2.13 A photograph of the page of the laboratory notebook recording the first blended cell
result. The structure of the blended cell and the J–V curve is indicated by red rectangle and arrow
Therefore, the author immediately attempted to explain the photovoltaic properties
of the three-layer cell based on the p-i-n junction. Figure 2.15a shows the energy
diagrams of the H 2 Pc and Me-PTC films prior to contact. The positions of the Fermi
levels (E F ) indicated that H 2 Pc and Me-PTC behave as p- and n-type semiconductors,
respectively.
35
Fig. 2.13 A photograph of the page of the laboratory notebook recording the first blended cell
result. The structure of the blended cell and the J–V curve is indicated by red rectangle and arrow
Therefore, the author immediately attempted to explain the photovoltaic properties
of the three-layer cell based on the p-i-n junction. Figure 2.15a shows the energy
diagrams of the H 2 Pc and Me-PTC films prior to contact. The positions of the Fermi
levels (E F ) indicated that H 2 Pc and Me-PTC behave as p- and n-type semiconductors,
respectively.