

184
T. Fujita
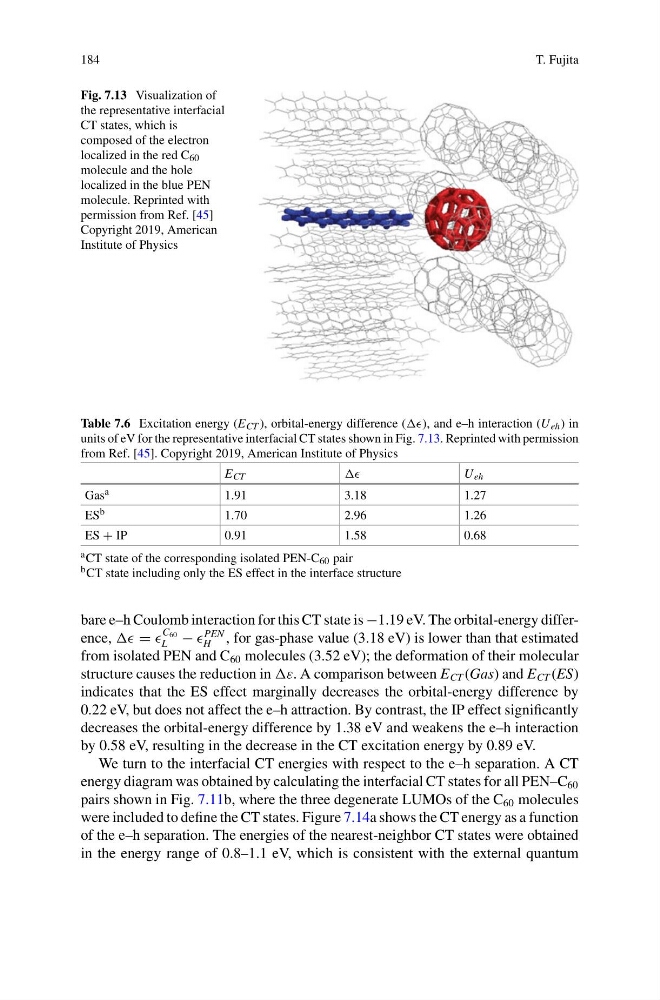
Fig. 7.13 Visualization of
the representative interfacial
CT states, which is
composed of the electron
localized in the red C 60
molecule and the hole
localized in the blue PEN
molecule. Reprinted with
permission from Ref. [45]
Copyright 2019, American
Institute of Physics
Table 7.6 Excitation energy (E CT ), orbital-energy difference (), and e–h interaction (U eh ) in
units of eV for the representative interfacial CT states shown in Fig. 7.13. Reprinted with permission
from Ref. [45]. Copyright 2019, American Institute of Physics
E CT
U eh
Gas a
1.91
3.18
1.27
ES b
1.70
2.96
1.26
ES + IP
0.91
1.58
0.68
a CT state of the corresponding isolated PEN-C 60 pair
b CT state including only the ES effect in the interface structure
bare e–h Coulomb interaction for this CT state is −1.19 eV. The orbital-energy difference, =
C 60
L −
PEN
H , for gas-phase value (3.18 eV) is lower than that estimated
from isolated PEN and C 60 molecules (3.52 eV); the deformation of their molecular
structure causes the reduction in ε. A comparison between E CT (Gas) and E CT (ES)
indicates that the ES effect marginally decreases the orbital-energy difference by
0.22 eV, but does not affect the e–h attraction. By contrast, the IP effect significantly
decreases the orbital-energy difference by 1.38 eV and weakens the e–h interaction
by 0.58 eV, resulting in the decrease in the CT excitation energy by 0.89 eV.
We turn to the interfacial CT energies with respect to the e–h separation. A CT
energy diagram was obtained by calculating the interfacial CT states for all PEN–C 60
pairs shown in Fig. 7.11b, where the three degenerate LUMOs of the C 60 molecules
were included to define the CT states. Figure 7.14a shows the CT energy as a function
of the e–h separation. The energies of the nearest-neighbor CT states were obtained
in the energy range of 0.8–1.1 eV, which is consistent with the external quantum
T. Fujita
Fig. 7.13 Visualization of
the representative interfacial
CT states, which is
composed of the electron
localized in the red C 60
molecule and the hole
localized in the blue PEN
molecule. Reprinted with
permission from Ref. [45]
Copyright 2019, American
Institute of Physics
Table 7.6 Excitation energy (E CT ), orbital-energy difference (), and e–h interaction (U eh ) in
units of eV for the representative interfacial CT states shown in Fig. 7.13. Reprinted with permission
from Ref. [45]. Copyright 2019, American Institute of Physics
E CT
U eh
Gas a
1.91
3.18
1.27
ES b
1.70
2.96
1.26
ES + IP
0.91
1.58
0.68
a CT state of the corresponding isolated PEN-C 60 pair
b CT state including only the ES effect in the interface structure
bare e–h Coulomb interaction for this CT state is −1.19 eV. The orbital-energy difference, =
C 60
L −
PEN
H , for gas-phase value (3.18 eV) is lower than that estimated
from isolated PEN and C 60 molecules (3.52 eV); the deformation of their molecular
structure causes the reduction in ε. A comparison between E CT (Gas) and E CT (ES)
indicates that the ES effect marginally decreases the orbital-energy difference by
0.22 eV, but does not affect the e–h attraction. By contrast, the IP effect significantly
decreases the orbital-energy difference by 1.38 eV and weakens the e–h interaction
by 0.58 eV, resulting in the decrease in the CT excitation energy by 0.89 eV.
We turn to the interfacial CT energies with respect to the e–h separation. A CT
energy diagram was obtained by calculating the interfacial CT states for all PEN–C 60
pairs shown in Fig. 7.11b, where the three degenerate LUMOs of the C 60 molecules
were included to define the CT states. Figure 7.14a shows the CT energy as a function
of the e–h separation. The energies of the nearest-neighbor CT states were obtained
in the energy range of 0.8–1.1 eV, which is consistent with the external quantum