

6 Charge Carrier Dynamics in Polymer Solar Cells
143
44–46]. It will be discussed later how bimolecular recombination is reduced in these
polymer/fullerene blend films in Sect. 6.6.
6.5.1 Bimolecular Recombination Dynamics
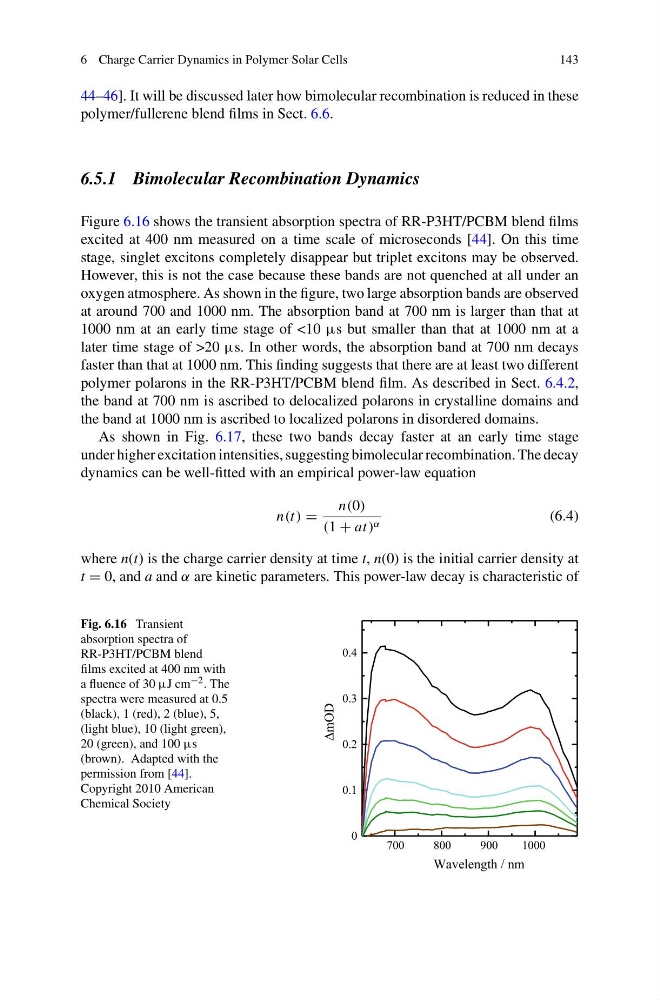
Figure 6.16 shows the transient absorption spectra of RR-P3HT/PCBM blend films
excited at 400 nm measured on a time scale of microseconds [44]. On this time
stage, singlet excitons completely disappear but triplet excitons may be observed.
However, this is not the case because these bands are not quenched at all under an
oxygen atmosphere. As shown in the figure, two large absorption bands are observed
at around 700 and 1000 nm. The absorption band at 700 nm is larger than that at
1000 nm at an early time stage of <10 μs but smaller than that at 1000 nm at a
later time stage of >20 μs. In other words, the absorption band at 700 nm decays
faster than that at 1000 nm. This finding suggests that there are at least two different
polymer polarons in the RR-P3HT/PCBM blend film. As described in Sect. 6.4.2,
the band at 700 nm is ascribed to delocalized polarons in crystalline domains and
the band at 1000 nm is ascribed to localized polarons in disordered domains.
As shown in Fig. 6.17, these two bands decay faster at an early time stage
under higher excitation intensities, suggesting bimolecular recombination. The decay
dynamics can be well-fitted with an empirical power-law equation
n(t) =
n(0)
(1 + at) α
(6.4)
where n(t) is the charge carrier density at time t, n(0) is the initial carrier density at
t = 0, and a and α are kinetic parameters. This power-law decay is characteristic of
Fig. 6.16 Transient
absorption spectra of
RR-P3HT/PCBM blend
films excited at 400 nm with
a fluence of 30 μJ cm −2 . The
spectra were measured at 0.5
(black), 1 (red), 2 (blue), 5,
(light blue), 10 (light green),
20 (green), and 100 μs
(brown). Adapted with the
permission from [44].
Copyright 2010 American
Chemical Society
700
800
900
1000
0
0.1
0.2
0.3
0.4
ΔmOD
Wavelength / nm
143
44–46]. It will be discussed later how bimolecular recombination is reduced in these
polymer/fullerene blend films in Sect. 6.6.
6.5.1 Bimolecular Recombination Dynamics
Figure 6.16 shows the transient absorption spectra of RR-P3HT/PCBM blend films
excited at 400 nm measured on a time scale of microseconds [44]. On this time
stage, singlet excitons completely disappear but triplet excitons may be observed.
However, this is not the case because these bands are not quenched at all under an
oxygen atmosphere. As shown in the figure, two large absorption bands are observed
at around 700 and 1000 nm. The absorption band at 700 nm is larger than that at
1000 nm at an early time stage of <10 μs but smaller than that at 1000 nm at a
later time stage of >20 μs. In other words, the absorption band at 700 nm decays
faster than that at 1000 nm. This finding suggests that there are at least two different
polymer polarons in the RR-P3HT/PCBM blend film. As described in Sect. 6.4.2,
the band at 700 nm is ascribed to delocalized polarons in crystalline domains and
the band at 1000 nm is ascribed to localized polarons in disordered domains.
As shown in Fig. 6.17, these two bands decay faster at an early time stage
under higher excitation intensities, suggesting bimolecular recombination. The decay
dynamics can be well-fitted with an empirical power-law equation
n(t) =
n(0)
(1 + at) α
(6.4)
where n(t) is the charge carrier density at time t, n(0) is the initial carrier density at
t = 0, and a and α are kinetic parameters. This power-law decay is characteristic of
Fig. 6.16 Transient
absorption spectra of
RR-P3HT/PCBM blend
films excited at 400 nm with
a fluence of 30 μJ cm −2 . The
spectra were measured at 0.5
(black), 1 (red), 2 (blue), 5,
(light blue), 10 (light green),
20 (green), and 100 μs
(brown). Adapted with the
permission from [44].
Copyright 2010 American
Chemical Society
700
800
900
1000
0
0.1
0.2
0.3
0.4
ΔmOD
Wavelength / nm