

134
H. Ohkita
6.4.2 Crystalline Polymer Solar Cells
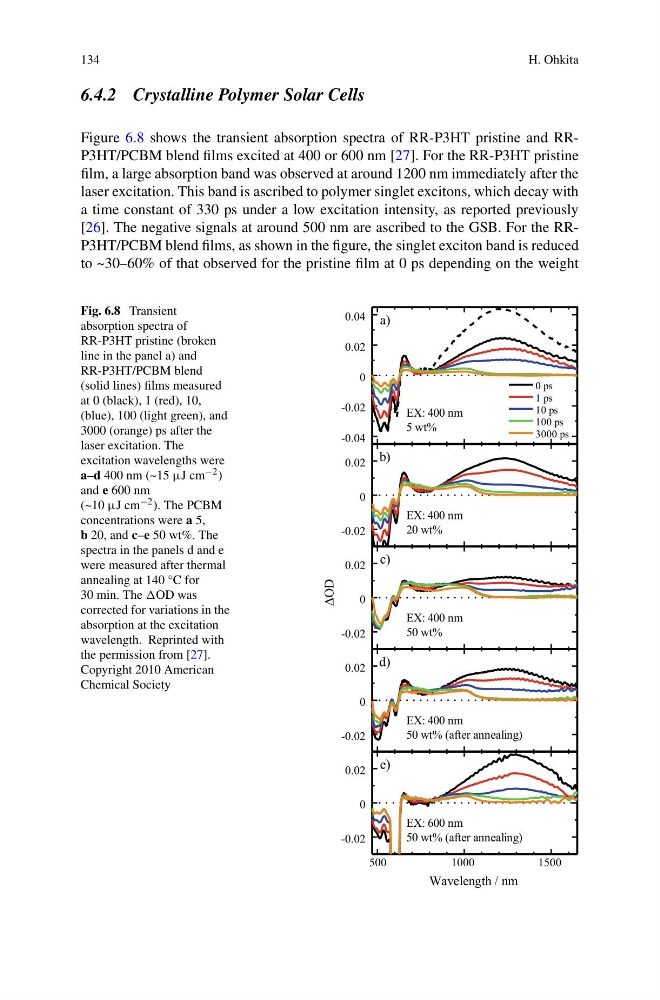
Figure 6.8 shows the transient absorption spectra of RR-P3HT pristine and RRP3HT/PCBM blend films excited at 400 or 600 nm [27]. For the RR-P3HT pristine
film, a large absorption band was observed at around 1200 nm immediately after the
laser excitation. This band is ascribed to polymer singlet excitons, which decay with
a time constant of 330 ps under a low excitation intensity, as reported previously
[26]. The negative signals at around 500 nm are ascribed to the GSB. For the RRP3HT/PCBM blend films, as shown in the figure, the singlet exciton band is reduced
to ~30–60% of that observed for the pristine film at 0 ps depending on the weight
Fig. 6.8 Transient
absorption spectra of
RR-P3HT pristine (broken
line in the panel a) and
RR-P3HT/PCBM blend
(solid lines) films measured
at 0 (black), 1 (red), 10,
(blue), 100 (light green), and
3000 (orange) ps after the
laser excitation. The
excitation wavelengths were
a–d 400 nm (~15 μJ cm −2 )
and e 600 nm
(~10 μJ cm −2 ). The PCBM
concentrations were a 5,
b 20, and c–e 50 wt%. The
spectra in the panels d and e
were measured after thermal
annealing at 140 °C for
30 min. The OD was
corrected for variations in the
absorption at the excitation
wavelength. Reprinted with
the permission from [27].
Copyright 2010 American
Chemical Society
-0.04
-0.02
0
0.02
0.04 a)
0 ps
1 ps
10 ps
100 ps
3000 ps
EX: 400 nm
5 wt%
-0.02
0
0.02 b)
EX: 400 nm
20 wt%
-0.02
0
0.02 c)
ΔOD
EX: 400 nm
50 wt%
500
1000
1500
-0.02
0
0.02
Wavelength / nm
e)
EX: 600 nm
50 wt% (after annealing)
-0.02
0
0.02 d)
EX: 400 nm
50 wt% (after annealing)
H. Ohkita
6.4.2 Crystalline Polymer Solar Cells
Figure 6.8 shows the transient absorption spectra of RR-P3HT pristine and RRP3HT/PCBM blend films excited at 400 or 600 nm [27]. For the RR-P3HT pristine
film, a large absorption band was observed at around 1200 nm immediately after the
laser excitation. This band is ascribed to polymer singlet excitons, which decay with
a time constant of 330 ps under a low excitation intensity, as reported previously
[26]. The negative signals at around 500 nm are ascribed to the GSB. For the RRP3HT/PCBM blend films, as shown in the figure, the singlet exciton band is reduced
to ~30–60% of that observed for the pristine film at 0 ps depending on the weight
Fig. 6.8 Transient
absorption spectra of
RR-P3HT pristine (broken
line in the panel a) and
RR-P3HT/PCBM blend
(solid lines) films measured
at 0 (black), 1 (red), 10,
(blue), 100 (light green), and
3000 (orange) ps after the
laser excitation. The
excitation wavelengths were
a–d 400 nm (~15 μJ cm −2 )
and e 600 nm
(~10 μJ cm −2 ). The PCBM
concentrations were a 5,
b 20, and c–e 50 wt%. The
spectra in the panels d and e
were measured after thermal
annealing at 140 °C for
30 min. The OD was
corrected for variations in the
absorption at the excitation
wavelength. Reprinted with
the permission from [27].
Copyright 2010 American
Chemical Society
-0.04
-0.02
0
0.02
0.04 a)
0 ps
1 ps
10 ps
100 ps
3000 ps
EX: 400 nm
5 wt%
-0.02
0
0.02 b)
EX: 400 nm
20 wt%
-0.02
0
0.02 c)
ΔOD
EX: 400 nm
50 wt%
500
1000
1500
-0.02
0
0.02
Wavelength / nm
e)
EX: 600 nm
50 wt% (after annealing)
-0.02
0
0.02 d)
EX: 400 nm
50 wt% (after annealing)