

6 Charge Carrier Dynamics in Polymer Solar Cells
133
therefore can quench efficiently singlet excitons before the exciton diffusion. This
would be true of other amorphous polymer blends. Indeed, such a prompt polaron
generation in a few picoseconds is observed for other amorphous polymer/PCBM
blend films like PCPDTBT/PCBM [29] and N-P7/PCBM blends [30].
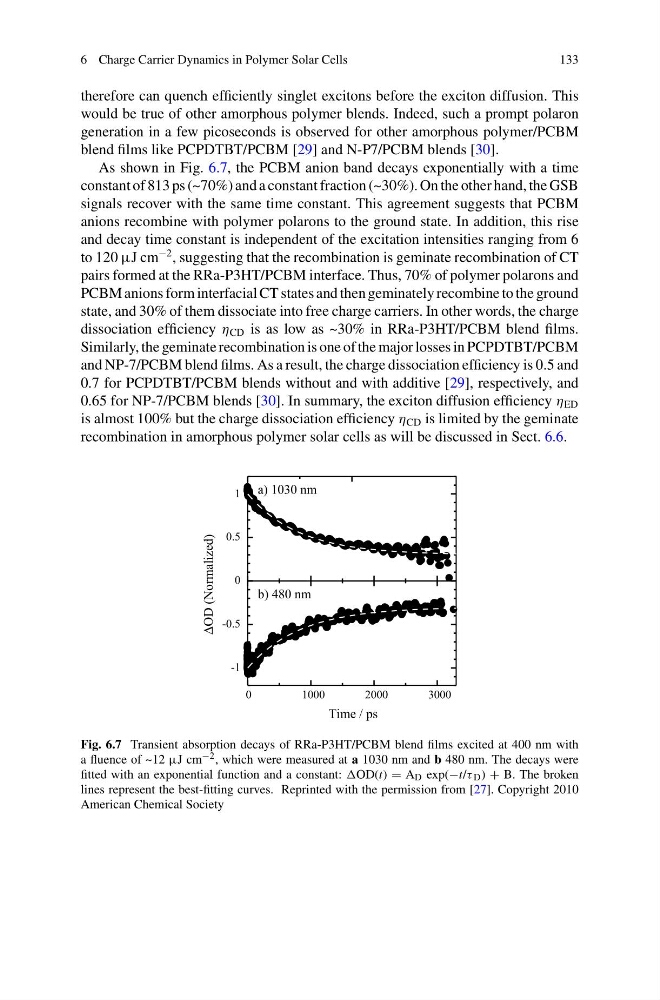
As shown in Fig. 6.7, the PCBM anion band decays exponentially with a time
constant of 813 ps (~70%) and a constant fraction (~30%). On the other hand, the GSB
signals recover with the same time constant. This agreement suggests that PCBM
anions recombine with polymer polarons to the ground state. In addition, this rise
and decay time constant is independent of the excitation intensities ranging from 6
to 120 μJ cm
−2 , suggesting that the recombination is geminate recombination of CT
pairs formed at the RRa-P3HT/PCBM interface. Thus, 70% of polymer polarons and
PCBM anions form interfacial CT states and then geminately recombine to the ground
state, and 30% of them dissociate into free charge carriers. In other words, the charge
dissociation efficiency η CD is as low as ~30% in RRa-P3HT/PCBM blend films.
Similarly, the geminate recombination is one of the major losses in PCPDTBT/PCBM
and NP-7/PCBM blend films. As a result, the charge dissociation efficiency is 0.5 and
0.7 for PCPDTBT/PCBM blends without and with additive [29], respectively, and
0.65 for NP-7/PCBM blends [30]. In summary, the exciton diffusion efficiency η ED
is almost 100% but the charge dissociation efficiency η CD is limited by the geminate
recombination in amorphous polymer solar cells as will be discussed in Sect. 6.6.
0
0.5
1 a) 1030 nm
ΔOD (Normalized)
0
1000
2000
3000
-1
-0.5
Time / ps
b) 480 nm
Fig. 6.7 Transient absorption decays of RRa-P3HT/PCBM blend films excited at 400 nm with
a fluence of ~12 μJ cm −2 , which were measured at a 1030 nm and b 480 nm. The decays were
fitted with an exponential function and a constant: OD(t) = A D exp(−t/τ D ) + B. The broken
lines represent the best-fitting curves. Reprinted with the permission from [27]. Copyright 2010
American Chemical Society
133
therefore can quench efficiently singlet excitons before the exciton diffusion. This
would be true of other amorphous polymer blends. Indeed, such a prompt polaron
generation in a few picoseconds is observed for other amorphous polymer/PCBM
blend films like PCPDTBT/PCBM [29] and N-P7/PCBM blends [30].
As shown in Fig. 6.7, the PCBM anion band decays exponentially with a time
constant of 813 ps (~70%) and a constant fraction (~30%). On the other hand, the GSB
signals recover with the same time constant. This agreement suggests that PCBM
anions recombine with polymer polarons to the ground state. In addition, this rise
and decay time constant is independent of the excitation intensities ranging from 6
to 120 μJ cm
−2 , suggesting that the recombination is geminate recombination of CT
pairs formed at the RRa-P3HT/PCBM interface. Thus, 70% of polymer polarons and
PCBM anions form interfacial CT states and then geminately recombine to the ground
state, and 30% of them dissociate into free charge carriers. In other words, the charge
dissociation efficiency η CD is as low as ~30% in RRa-P3HT/PCBM blend films.
Similarly, the geminate recombination is one of the major losses in PCPDTBT/PCBM
and NP-7/PCBM blend films. As a result, the charge dissociation efficiency is 0.5 and
0.7 for PCPDTBT/PCBM blends without and with additive [29], respectively, and
0.65 for NP-7/PCBM blends [30]. In summary, the exciton diffusion efficiency η ED
is almost 100% but the charge dissociation efficiency η CD is limited by the geminate
recombination in amorphous polymer solar cells as will be discussed in Sect. 6.6.
0
0.5
1 a) 1030 nm
ΔOD (Normalized)
0
1000
2000
3000
-1
-0.5
Time / ps
b) 480 nm
Fig. 6.7 Transient absorption decays of RRa-P3HT/PCBM blend films excited at 400 nm with
a fluence of ~12 μJ cm −2 , which were measured at a 1030 nm and b 480 nm. The decays were
fitted with an exponential function and a constant: OD(t) = A D exp(−t/τ D ) + B. The broken
lines represent the best-fitting curves. Reprinted with the permission from [27]. Copyright 2010
American Chemical Society