

112
I. Osaka
the bandgap. This trend is consistent with results in the shift of HOMO and LUMO
energy levels.
We
fabricated
solar
cells
that
used
these
polymers
with
ITO/ZnO/(polymer/PC 71 BM)/MoO x /Ag stacking. The optimum polymer to
PC 71 BM weight ratio was 1:1.5 for the F2–F2 cell and 1:2 for the other cells.
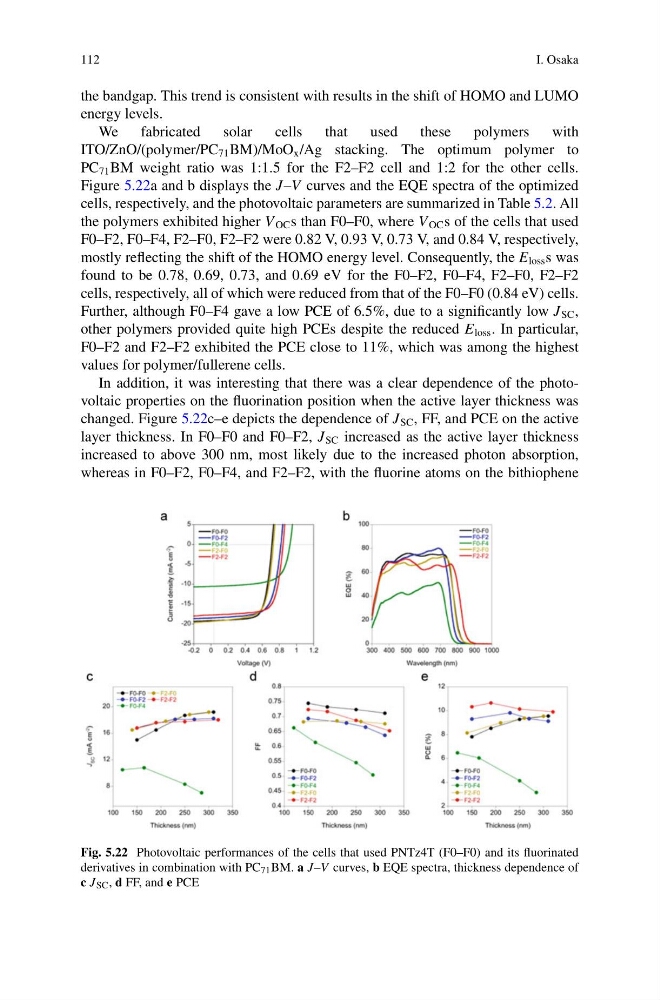
Figure 5.22a and b displays the J–V curves and the EQE spectra of the optimized
cells, respectively, and the photovoltaic parameters are summarized in Table 5.2. All
the polymers exhibited higher V OC s than F0–F0, where V OC s of the cells that used
F0–F2, F0–F4, F2–F0, F2–F2 were 0.82 V, 0.93 V, 0.73 V, and 0.84 V, respectively,
mostly reflecting the shift of the HOMO energy level. Consequently, the E loss s was
found to be 0.78, 0.69, 0.73, and 0.69 eV for the F0–F2, F0–F4, F2–F0, F2–F2
cells, respectively, all of which were reduced from that of the F0–F0 (0.84 eV) cells.
Further, although F0–F4 gave a low PCE of 6.5%, due to a significantly low J SC ,
other polymers provided quite high PCEs despite the reduced E loss . In particular,
F0–F2 and F2–F2 exhibited the PCE close to 11%, which was among the highest
values for polymer/fullerene cells.
In addition, it was interesting that there was a clear dependence of the photovoltaic properties on the fluorination position when the active layer thickness was
changed. Figure 5.22c–e depicts the dependence of J SC , FF, and PCE on the active
layer thickness. In F0–F0 and F0–F2, J SC increased as the active layer thickness
increased to above 300 nm, most likely due to the increased photon absorption,
whereas in F0–F2, F0–F4, and F2–F2, with the fluorine atoms on the bithiophene
Fig. 5.22 Photovoltaic performances of the cells that used PNTz4T (F0–F0) and its fluorinated
derivatives in combination with PC 71 BM. a J–V curves, b EQE spectra, thickness dependence of
c J SC , d FF, and e PCE
I. Osaka
the bandgap. This trend is consistent with results in the shift of HOMO and LUMO
energy levels.
We
fabricated
solar
cells
that
used
these
polymers
with
ITO/ZnO/(polymer/PC 71 BM)/MoO x /Ag stacking. The optimum polymer to
PC 71 BM weight ratio was 1:1.5 for the F2–F2 cell and 1:2 for the other cells.
Figure 5.22a and b displays the J–V curves and the EQE spectra of the optimized
cells, respectively, and the photovoltaic parameters are summarized in Table 5.2. All
the polymers exhibited higher V OC s than F0–F0, where V OC s of the cells that used
F0–F2, F0–F4, F2–F0, F2–F2 were 0.82 V, 0.93 V, 0.73 V, and 0.84 V, respectively,
mostly reflecting the shift of the HOMO energy level. Consequently, the E loss s was
found to be 0.78, 0.69, 0.73, and 0.69 eV for the F0–F2, F0–F4, F2–F0, F2–F2
cells, respectively, all of which were reduced from that of the F0–F0 (0.84 eV) cells.
Further, although F0–F4 gave a low PCE of 6.5%, due to a significantly low J SC ,
other polymers provided quite high PCEs despite the reduced E loss . In particular,
F0–F2 and F2–F2 exhibited the PCE close to 11%, which was among the highest
values for polymer/fullerene cells.
In addition, it was interesting that there was a clear dependence of the photovoltaic properties on the fluorination position when the active layer thickness was
changed. Figure 5.22c–e depicts the dependence of J SC , FF, and PCE on the active
layer thickness. In F0–F0 and F0–F2, J SC increased as the active layer thickness
increased to above 300 nm, most likely due to the increased photon absorption,
whereas in F0–F2, F0–F4, and F2–F2, with the fluorine atoms on the bithiophene
Fig. 5.22 Photovoltaic performances of the cells that used PNTz4T (F0–F0) and its fluorinated
derivatives in combination with PC 71 BM. a J–V curves, b EQE spectra, thickness dependence of
c J SC , d FF, and e PCE