

Hexagonal Boron Nitride (h-BN) in Solutes Separation
173
two water sections including 1800 water molecules. Additionally, 20 Na
+ and 20
Cl
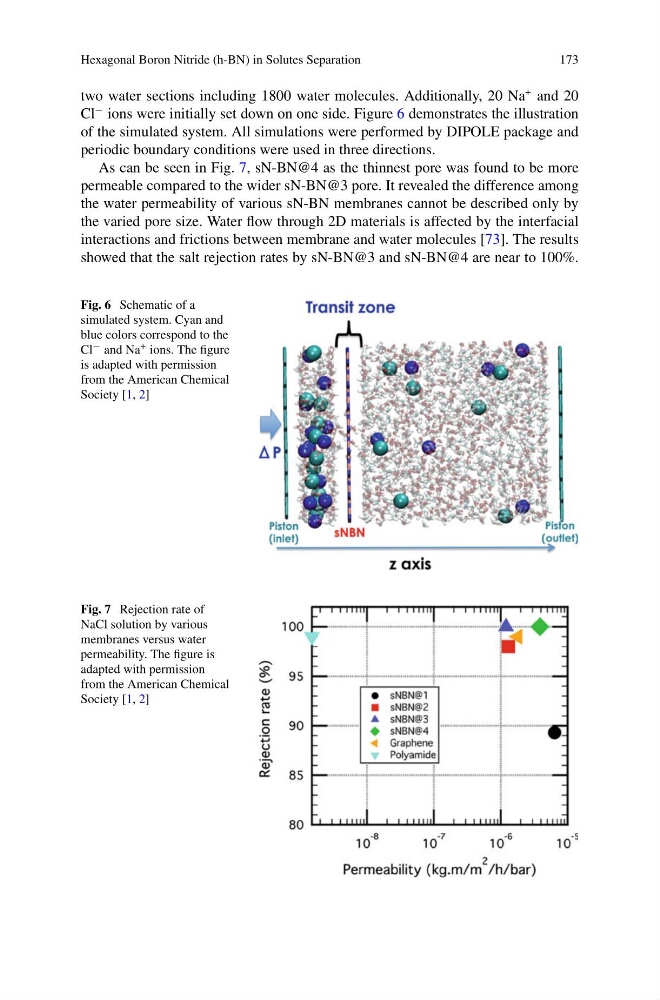
− ions were initially set down on one side. Figure 6 demonstrates the illustration
of the simulated system. All simulations were performed by DIPOLE package and
periodic boundary conditions were used in three directions.
As can be seen in Fig. 7, sN-BN@4 as the thinnest pore was found to be more
permeable compared to the wider sN-BN@3 pore. It revealed the difference among
the water permeability of various sN-BN membranes cannot be described only by
the varied pore size. Water flow through 2D materials is affected by the interfacial
interactions and frictions between membrane and water molecules [73]. The results
showed that the salt rejection rates by sN-BN@3 and sN-BN@4 are near to 100%.
Fig. 6 Schematic of a
simulated system. Cyan and
blue colors correspond to the
Cl − and Na + ions. The figure
is adapted with permission
from the American Chemical
Society [1, 2]
Fig. 7 Rejection rate of
NaCl solution by various
membranes versus water
permeability. The figure is
adapted with permission
from the American Chemical
Society [1, 2]
173
two water sections including 1800 water molecules. Additionally, 20 Na
+ and 20
Cl
− ions were initially set down on one side. Figure 6 demonstrates the illustration
of the simulated system. All simulations were performed by DIPOLE package and
periodic boundary conditions were used in three directions.
As can be seen in Fig. 7, sN-BN@4 as the thinnest pore was found to be more
permeable compared to the wider sN-BN@3 pore. It revealed the difference among
the water permeability of various sN-BN membranes cannot be described only by
the varied pore size. Water flow through 2D materials is affected by the interfacial
interactions and frictions between membrane and water molecules [73]. The results
showed that the salt rejection rates by sN-BN@3 and sN-BN@4 are near to 100%.
Fig. 6 Schematic of a
simulated system. Cyan and
blue colors correspond to the
Cl − and Na + ions. The figure
is adapted with permission
from the American Chemical
Society [1, 2]
Fig. 7 Rejection rate of
NaCl solution by various
membranes versus water
permeability. The figure is
adapted with permission
from the American Chemical
Society [1, 2]