

Graphene Oxide and Reduced Graphene Oxide as Nanofillers …
127
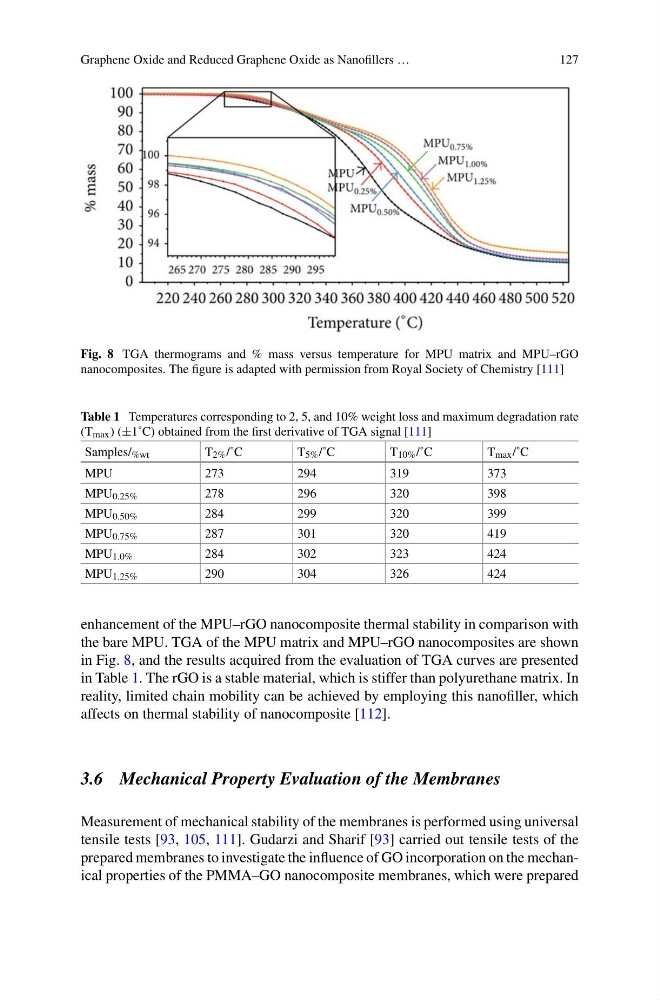
Fig. 8 TGA thermograms and % mass versus temperature for MPU matrix and MPU–rGO
nanocomposites. The figure is adapted with permission from Royal Society of Chemistry [111]
Table 1 Temperatures corresponding to 2, 5, and 10% weight loss and maximum degradation rate
(T max ) (±1˚C) obtained from the first derivative of TGA signal [111]
Samples/ %wt
T 2% /˚C
T 5% /˚C
T 10% /˚C
T max /˚C
MPU
273
294
319
373
MPU 0.25%
278
296
320
398
MPU 0.50%
284
299
320
399
MPU 0.75%
287
301
320
419
MPU 1.0%
284
302
323
424
MPU 1.25%
290
304
326
424
enhancement of the MPU–rGO nanocomposite thermal stability in comparison with
the bare MPU. TGA of the MPU matrix and MPU–rGO nanocomposites are shown
in Fig. 8, and the results acquired from the evaluation of TGA curves are presented
in Table 1. The rGO is a stable material, which is stiffer than polyurethane matrix. In
reality, limited chain mobility can be achieved by employing this nanofiller, which
affects on thermal stability of nanocomposite [112].
3.6 Mechanical Property Evaluation of the Membranes
Measurement of mechanical stability of the membranes is performed using universal
tensile tests [93, 105, 111]. Gudarzi and Sharif [93] carried out tensile tests of the
prepared membranes to investigate the influence of GO incorporation on the mechanical properties of the PMMA–GO nanocomposite membranes, which were prepared
127
Fig. 8 TGA thermograms and % mass versus temperature for MPU matrix and MPU–rGO
nanocomposites. The figure is adapted with permission from Royal Society of Chemistry [111]
Table 1 Temperatures corresponding to 2, 5, and 10% weight loss and maximum degradation rate
(T max ) (±1˚C) obtained from the first derivative of TGA signal [111]
Samples/ %wt
T 2% /˚C
T 5% /˚C
T 10% /˚C
T max /˚C
MPU
273
294
319
373
MPU 0.25%
278
296
320
398
MPU 0.50%
284
299
320
399
MPU 0.75%
287
301
320
419
MPU 1.0%
284
302
323
424
MPU 1.25%
290
304
326
424
enhancement of the MPU–rGO nanocomposite thermal stability in comparison with
the bare MPU. TGA of the MPU matrix and MPU–rGO nanocomposites are shown
in Fig. 8, and the results acquired from the evaluation of TGA curves are presented
in Table 1. The rGO is a stable material, which is stiffer than polyurethane matrix. In
reality, limited chain mobility can be achieved by employing this nanofiller, which
affects on thermal stability of nanocomposite [112].
3.6 Mechanical Property Evaluation of the Membranes
Measurement of mechanical stability of the membranes is performed using universal
tensile tests [93, 105, 111]. Gudarzi and Sharif [93] carried out tensile tests of the
prepared membranes to investigate the influence of GO incorporation on the mechanical properties of the PMMA–GO nanocomposite membranes, which were prepared