

3 Reactor Kinetics
67
Table 3.6 Comparison between measured and calculated (MCNP6.1 with JENDL-4.0) reactivities
[pcm] of excess and control rods (C1, C2, and C3) (Ref. [10])
Reactivity
Calculation
Experiment
C/E a
Excess
149 ± 11
149 ± 3
1.00 ± 0.08
C1
567 ± 11
549 ± 3
1.03 ± 0.02
C2
189 ± 11
194 ± 1
0.98 ± 0.06
C3
498 ± 11
483 ± 2
1.03 ± 0.02
a Calculation/Experiment
3.2.1.3 Numerical Simulations
Numerical calculations were performed by the Monte Carlo transport code,
MCNP6.1 together with JENDL-4.0 for transport and with JENDL/HE-2007 [18]
for high-energy protons and spallation neutrons. Here, in MCNP6.1, since the effects
of reactivity by neutron detectors (optical fiber, FC, and UIC detectors) and control
(safety) rods are not negligible, neutron detectors and control (safety) rods were
included in the simulated geometry and transport calculations. The precision of
numerical reactivities of excess and control rods (C1, C2, and C3) in pcm units was
attained by the eigenvalue calculations within a relative difference of 3% between
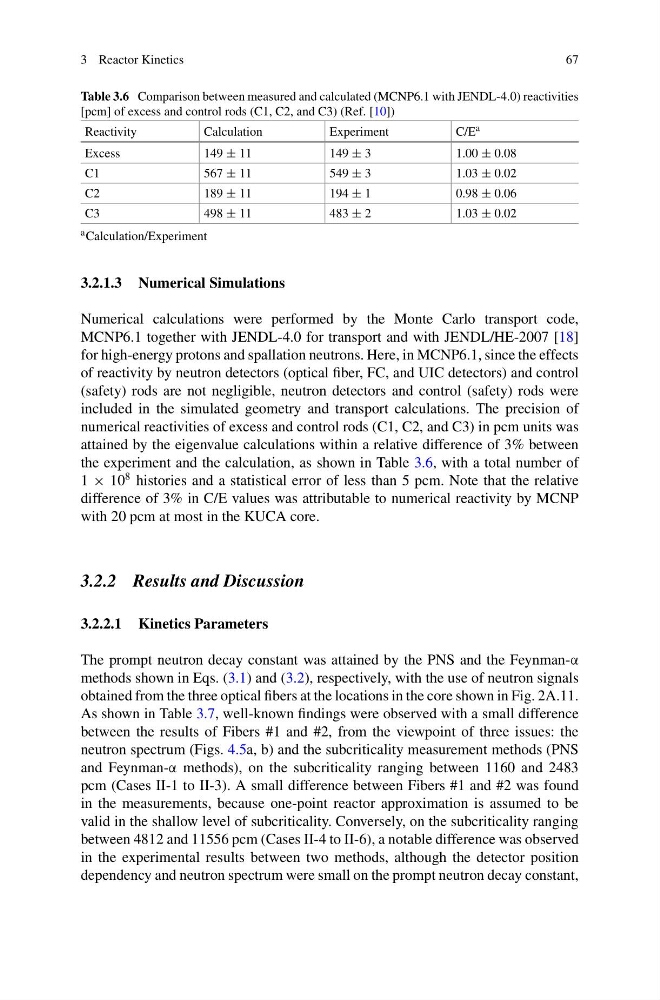
the experiment and the calculation, as shown in Table 3.6, with a total number of
1 × 10
8 histories and a statistical error of less than 5 pcm. Note that the relative
difference of 3% in C/E values was attributable to numerical reactivity by MCNP
with 20 pcm at most in the KUCA core.
3.2.2 Results and Discussion
3.2.2.1 Kinetics Parameters
The prompt neutron decay constant was attained by the PNS and the Feynman-α
methods shown in Eqs. (3.1) and (3.2), respectively, with the use of neutron signals
obtained from the three optical fibers at the locations in the core shown in Fig. 2A.11.
As shown in Table 3.7, well-known findings were observed with a small difference
between the results of Fibers #1 and #2, from the viewpoint of three issues: the
neutron spectrum (Figs. 4.5a, b) and the subcriticality measurement methods (PNS
and Feynman-α methods), on the subcriticality ranging between 1160 and 2483
pcm (Cases II-1 to II-3). A small difference between Fibers #1 and #2 was found
in the measurements, because one-point reactor approximation is assumed to be
valid in the shallow level of subcriticality. Conversely, on the subcriticality ranging
between 4812 and 11556 pcm (Cases II-4 to II-6), a notable difference was observed
in the experimental results between two methods, although the detector position
dependency and neutron spectrum were small on the prompt neutron decay constant,
67
Table 3.6 Comparison between measured and calculated (MCNP6.1 with JENDL-4.0) reactivities
[pcm] of excess and control rods (C1, C2, and C3) (Ref. [10])
Reactivity
Calculation
Experiment
C/E a
Excess
149 ± 11
149 ± 3
1.00 ± 0.08
C1
567 ± 11
549 ± 3
1.03 ± 0.02
C2
189 ± 11
194 ± 1
0.98 ± 0.06
C3
498 ± 11
483 ± 2
1.03 ± 0.02
a Calculation/Experiment
3.2.1.3 Numerical Simulations
Numerical calculations were performed by the Monte Carlo transport code,
MCNP6.1 together with JENDL-4.0 for transport and with JENDL/HE-2007 [18]
for high-energy protons and spallation neutrons. Here, in MCNP6.1, since the effects
of reactivity by neutron detectors (optical fiber, FC, and UIC detectors) and control
(safety) rods are not negligible, neutron detectors and control (safety) rods were
included in the simulated geometry and transport calculations. The precision of
numerical reactivities of excess and control rods (C1, C2, and C3) in pcm units was
attained by the eigenvalue calculations within a relative difference of 3% between
the experiment and the calculation, as shown in Table 3.6, with a total number of
1 × 10
8 histories and a statistical error of less than 5 pcm. Note that the relative
difference of 3% in C/E values was attributable to numerical reactivity by MCNP
with 20 pcm at most in the KUCA core.
3.2.2 Results and Discussion
3.2.2.1 Kinetics Parameters
The prompt neutron decay constant was attained by the PNS and the Feynman-α
methods shown in Eqs. (3.1) and (3.2), respectively, with the use of neutron signals
obtained from the three optical fibers at the locations in the core shown in Fig. 2A.11.
As shown in Table 3.7, well-known findings were observed with a small difference
between the results of Fibers #1 and #2, from the viewpoint of three issues: the
neutron spectrum (Figs. 4.5a, b) and the subcriticality measurement methods (PNS
and Feynman-α methods), on the subcriticality ranging between 1160 and 2483
pcm (Cases II-1 to II-3). A small difference between Fibers #1 and #2 was found
in the measurements, because one-point reactor approximation is assumed to be
valid in the shallow level of subcriticality. Conversely, on the subcriticality ranging
between 4812 and 11556 pcm (Cases II-4 to II-6), a notable difference was observed
in the experimental results between two methods, although the detector position
dependency and neutron spectrum were small on the prompt neutron decay constant,