

66
C. H. Pyeon
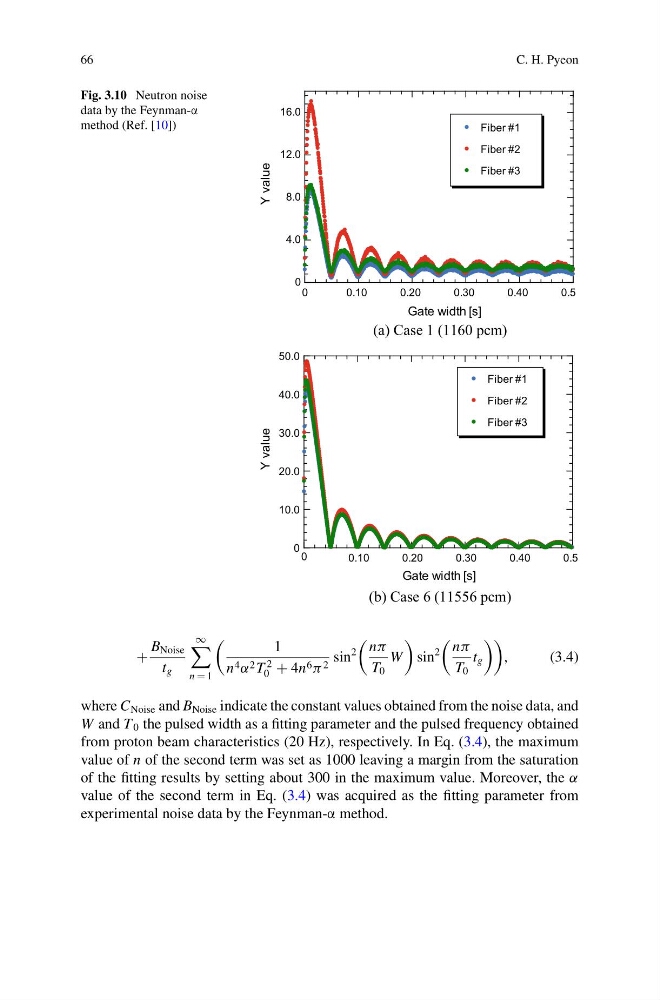
Fig. 3.10 Neutron noise
data by the Feynman-α
method (Ref. [10])
(a) Case 1 (1160 pcm)
(b) Case 6 (11556 pcm)
0
0.10
0.20
0.30
0.40
0.5
0
4.0
8.0
12.0
16.0
Gate width [s]
Y value
Fiber #1
Fiber #2
Fiber #3
0
0.10
0.20
0.30
0.40
0.5
0
10.0
20.0
30.0
40.0
50.0
Gate width [s]
Fiber #1
Fiber #2
Fiber #3
Y value
+
B Noise
t g
∞
n = 1
1
n 4 α 2 T
2
0 + 4n 6 π 2 sin
2
nπ
T 0
W
sin
2
nπ
T 0
t g
,
(3.4)
where C Noise and B Noise indicate the constant values obtained from the noise data, and
W and T 0 the pulsed width as a fitting parameter and the pulsed frequency obtained
from proton beam characteristics (20 Hz), respectively. In Eq. (3.4), the maximum
value of n of the second term was set as 1000 leaving a margin from the saturation
of the fitting results by setting about 300 in the maximum value. Moreover, the α
value of the second term in Eq. (3.4) was acquired as the fitting parameter from
experimental noise data by the Feynman-α method.
C. H. Pyeon
Fig. 3.10 Neutron noise
data by the Feynman-α
method (Ref. [10])
(a) Case 1 (1160 pcm)
(b) Case 6 (11556 pcm)
0
0.10
0.20
0.30
0.40
0.5
0
4.0
8.0
12.0
16.0
Gate width [s]
Y value
Fiber #1
Fiber #2
Fiber #3
0
0.10
0.20
0.30
0.40
0.5
0
10.0
20.0
30.0
40.0
50.0
Gate width [s]
Fiber #1
Fiber #2
Fiber #3
Y value
+
B Noise
t g
∞
n = 1
1
n 4 α 2 T
2
0 + 4n 6 π 2 sin
2
nπ
T 0
W
sin
2
nπ
T 0
t g
,
(3.4)
where C Noise and B Noise indicate the constant values obtained from the noise data, and
W and T 0 the pulsed width as a fitting parameter and the pulsed frequency obtained
from proton beam characteristics (20 Hz), respectively. In Eq. (3.4), the maximum
value of n of the second term was set as 1000 leaving a margin from the saturation
of the fitting results by setting about 300 in the maximum value. Moreover, the α
value of the second term in Eq. (3.4) was acquired as the fitting parameter from
experimental noise data by the Feynman-α method.