

3 Reactor Kinetics
65
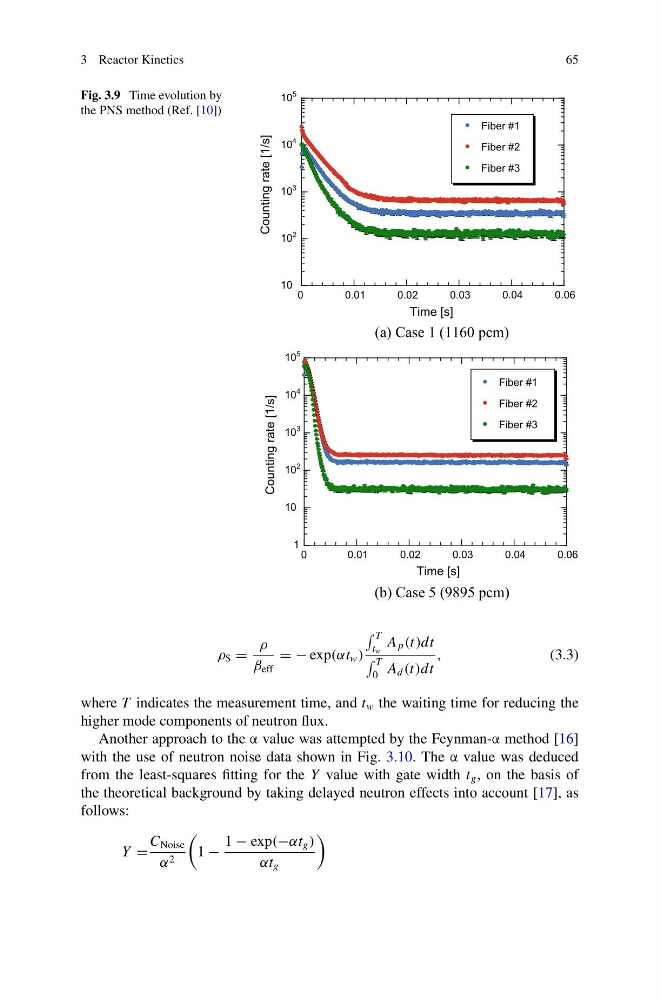
Fig. 3.9 Time evolution by
the PNS method (Ref. [10])
(a) Case 1 (1160 pcm)
(b) Case 5 (9895 pcm)
0
0.01
0.02
0.03
0.04
0.06
1
10
10
2
10
3
10
4
10
5
Time [s]
Counting rate [1/s]
Fiber #1
Fiber #2
Fiber #3
0
0.01
0.02
0.03
0.04
0.06
10
10
2
10
3
10
4
10
5
Time [s]
Counting rate [1/s]
Fiber #1
Fiber #2
Fiber #3
ρ $ =
ρ
β eff
= − exp(αt w )
T
t w
A p (t)dt
T
0 A d (t)dt
,
(3.3)
where T indicates the measurement time, and t w the waiting time for reducing the
higher mode components of neutron flux.
Another approach to the α value was attempted by the Feynman-α method [16]
with the use of neutron noise data shown in Fig. 3.10. The α value was deduced
from the least-squares fitting for the Y value with gate width t g , on the basis of
the theoretical background by taking delayed neutron effects into account [17], as
follows:
Y =
C Noise
α 2
1 −
1 − exp(−αt g )
αt g
65
Fig. 3.9 Time evolution by
the PNS method (Ref. [10])
(a) Case 1 (1160 pcm)
(b) Case 5 (9895 pcm)
0
0.01
0.02
0.03
0.04
0.06
1
10
10
2
10
3
10
4
10
5
Time [s]
Counting rate [1/s]
Fiber #1
Fiber #2
Fiber #3
0
0.01
0.02
0.03
0.04
0.06
10
10
2
10
3
10
4
10
5
Time [s]
Counting rate [1/s]
Fiber #1
Fiber #2
Fiber #3
ρ $ =
ρ
β eff
= − exp(αt w )
T
t w
A p (t)dt
T
0 A d (t)dt
,
(3.3)
where T indicates the measurement time, and t w the waiting time for reducing the
higher mode components of neutron flux.
Another approach to the α value was attempted by the Feynman-α method [16]
with the use of neutron noise data shown in Fig. 3.10. The α value was deduced
from the least-squares fitting for the Y value with gate width t g , on the basis of
the theoretical background by taking delayed neutron effects into account [17], as
follows:
Y =
C Noise
α 2
1 −
1 − exp(−αt g )
αt g