

68
C. H. Pyeon
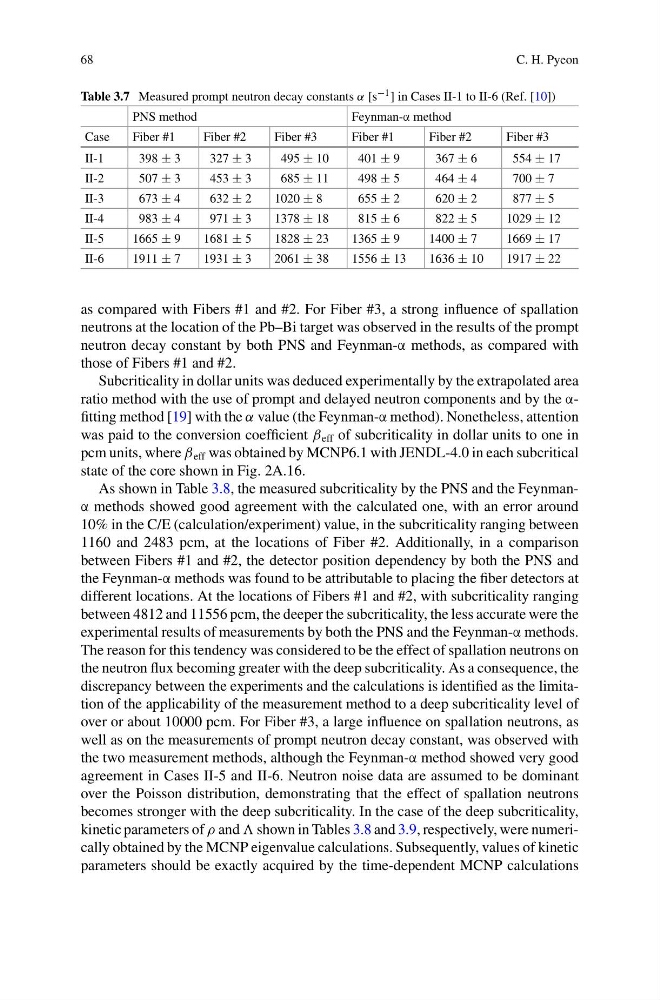
Table 3.7 Measured prompt neutron decay constants α [s −1 ] in Cases II-1 to II-6 (Ref. [10])
PNS method
Feynman-α method
Case
Fiber #1
Fiber #2
Fiber #3
Fiber #1
Fiber #2
Fiber #3
II-1
398 ± 3
327 ± 3
495 ± 10
401 ± 9
367 ± 6
554 ± 17
II-2
507 ± 3
453 ± 3
685 ± 11
498 ± 5
464 ± 4
700 ± 7
II-3
673 ± 4
632 ± 2
1020 ± 8
655 ± 2
620 ± 2
877 ± 5
II-4
983 ± 4
971 ± 3
1378 ± 18
815 ± 6
822 ± 5
1029 ± 12
II-5
1665 ± 9
1681 ± 5
1828 ± 23
1365 ± 9
1400 ± 7
1669 ± 17
II-6
1911 ± 7
1931 ± 3
2061 ± 38
1556 ± 13
1636 ± 10
1917 ± 22
as compared with Fibers #1 and #2. For Fiber #3, a strong influence of spallation
neutrons at the location of the Pb–Bi target was observed in the results of the prompt
neutron decay constant by both PNS and Feynman-α methods, as compared with
those of Fibers #1 and #2.
Subcriticality in dollar units was deduced experimentally by the extrapolated area
ratio method with the use of prompt and delayed neutron components and by the αfitting method [19] with the α value (the Feynman-α method). Nonetheless, attention
was paid to the conversion coefficient β eff of subcriticality in dollar units to one in
pcm units, where β eff was obtained by MCNP6.1 with JENDL-4.0 in each subcritical
state of the core shown in Fig. 2A.16.
As shown in Table 3.8, the measured subcriticality by the PNS and the Feynmanα methods showed good agreement with the calculated one, with an error around
10% in the C/E (calculation/experiment) value, in the subcriticality ranging between
1160 and 2483 pcm, at the locations of Fiber #2. Additionally, in a comparison
between Fibers #1 and #2, the detector position dependency by both the PNS and
the Feynman-α methods was found to be attributable to placing the fiber detectors at
different locations. At the locations of Fibers #1 and #2, with subcriticality ranging
between 4812 and 11556 pcm, the deeper the subcriticality, the less accurate were the
experimental results of measurements by both the PNS and the Feynman-α methods.
The reason for this tendency was considered to be the effect of spallation neutrons on
the neutron flux becoming greater with the deep subcriticality. As a consequence, the
discrepancy between the experiments and the calculations is identified as the limitation of the applicability of the measurement method to a deep subcriticality level of
over or about 10000 pcm. For Fiber #3, a large influence on spallation neutrons, as
well as on the measurements of prompt neutron decay constant, was observed with
the two measurement methods, although the Feynman-α method showed very good
agreement in Cases II-5 and II-6. Neutron noise data are assumed to be dominant
over the Poisson distribution, demonstrating that the effect of spallation neutrons
becomes stronger with the deep subcriticality. In the case of the deep subcriticality,
kinetic parameters of ρ and shown in Tables 3.8 and 3.9, respectively, were numerically obtained by the MCNP eigenvalue calculations. Subsequently, values of kinetic
parameters should be exactly acquired by the time-dependent MCNP calculations
C. H. Pyeon
Table 3.7 Measured prompt neutron decay constants α [s −1 ] in Cases II-1 to II-6 (Ref. [10])
PNS method
Feynman-α method
Case
Fiber #1
Fiber #2
Fiber #3
Fiber #1
Fiber #2
Fiber #3
II-1
398 ± 3
327 ± 3
495 ± 10
401 ± 9
367 ± 6
554 ± 17
II-2
507 ± 3
453 ± 3
685 ± 11
498 ± 5
464 ± 4
700 ± 7
II-3
673 ± 4
632 ± 2
1020 ± 8
655 ± 2
620 ± 2
877 ± 5
II-4
983 ± 4
971 ± 3
1378 ± 18
815 ± 6
822 ± 5
1029 ± 12
II-5
1665 ± 9
1681 ± 5
1828 ± 23
1365 ± 9
1400 ± 7
1669 ± 17
II-6
1911 ± 7
1931 ± 3
2061 ± 38
1556 ± 13
1636 ± 10
1917 ± 22
as compared with Fibers #1 and #2. For Fiber #3, a strong influence of spallation
neutrons at the location of the Pb–Bi target was observed in the results of the prompt
neutron decay constant by both PNS and Feynman-α methods, as compared with
those of Fibers #1 and #2.
Subcriticality in dollar units was deduced experimentally by the extrapolated area
ratio method with the use of prompt and delayed neutron components and by the αfitting method [19] with the α value (the Feynman-α method). Nonetheless, attention
was paid to the conversion coefficient β eff of subcriticality in dollar units to one in
pcm units, where β eff was obtained by MCNP6.1 with JENDL-4.0 in each subcritical
state of the core shown in Fig. 2A.16.
As shown in Table 3.8, the measured subcriticality by the PNS and the Feynmanα methods showed good agreement with the calculated one, with an error around
10% in the C/E (calculation/experiment) value, in the subcriticality ranging between
1160 and 2483 pcm, at the locations of Fiber #2. Additionally, in a comparison
between Fibers #1 and #2, the detector position dependency by both the PNS and
the Feynman-α methods was found to be attributable to placing the fiber detectors at
different locations. At the locations of Fibers #1 and #2, with subcriticality ranging
between 4812 and 11556 pcm, the deeper the subcriticality, the less accurate were the
experimental results of measurements by both the PNS and the Feynman-α methods.
The reason for this tendency was considered to be the effect of spallation neutrons on
the neutron flux becoming greater with the deep subcriticality. As a consequence, the
discrepancy between the experiments and the calculations is identified as the limitation of the applicability of the measurement method to a deep subcriticality level of
over or about 10000 pcm. For Fiber #3, a large influence on spallation neutrons, as
well as on the measurements of prompt neutron decay constant, was observed with
the two measurement methods, although the Feynman-α method showed very good
agreement in Cases II-5 and II-6. Neutron noise data are assumed to be dominant
over the Poisson distribution, demonstrating that the effect of spallation neutrons
becomes stronger with the deep subcriticality. In the case of the deep subcriticality,
kinetic parameters of ρ and shown in Tables 3.8 and 3.9, respectively, were numerically obtained by the MCNP eigenvalue calculations. Subsequently, values of kinetic
parameters should be exactly acquired by the time-dependent MCNP calculations