

2 Subcriticality
21
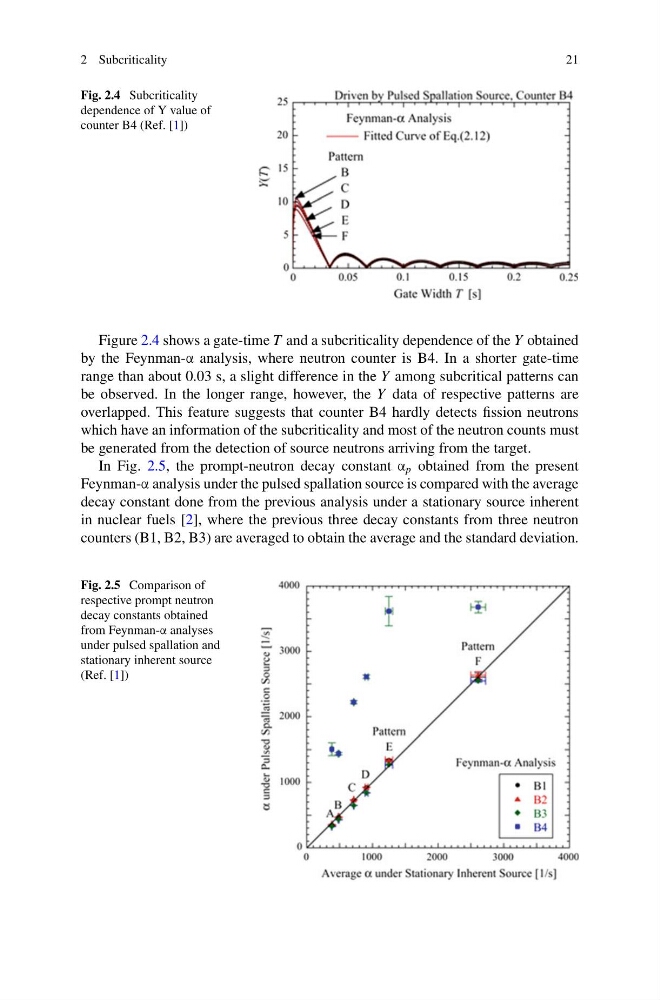
Fig. 2.4 Subcriticality
dependence of Y value of
counter B4 (Ref. [1])
Figure 2.4 shows a gate-time T and a subcriticality dependence of the Y obtained
by the Feynman-α analysis, where neutron counter is B4. In a shorter gate-time
range than about 0.03 s, a slight difference in the Y among subcritical patterns can
be observed. In the longer range, however, the Y data of respective patterns are
overlapped. This feature suggests that counter B4 hardly detects fission neutrons
which have an information of the subcriticality and most of the neutron counts must
be generated from the detection of source neutrons arriving from the target.
In Fig. 2.5, the prompt-neutron decay constant α p obtained from the present
Feynman-α analysis under the pulsed spallation source is compared with the average
decay constant done from the previous analysis under a stationary source inherent
in nuclear fuels [2], where the previous three decay constants from three neutron
counters (B1, B2, B3) are averaged to obtain the average and the standard deviation.
Fig. 2.5 Comparison of
respective prompt neutron
decay constants obtained
from Feynman-α analyses
under pulsed spallation and
stationary inherent source
(Ref. [1])
21
Fig. 2.4 Subcriticality
dependence of Y value of
counter B4 (Ref. [1])
Figure 2.4 shows a gate-time T and a subcriticality dependence of the Y obtained
by the Feynman-α analysis, where neutron counter is B4. In a shorter gate-time
range than about 0.03 s, a slight difference in the Y among subcritical patterns can
be observed. In the longer range, however, the Y data of respective patterns are
overlapped. This feature suggests that counter B4 hardly detects fission neutrons
which have an information of the subcriticality and most of the neutron counts must
be generated from the detection of source neutrons arriving from the target.
In Fig. 2.5, the prompt-neutron decay constant α p obtained from the present
Feynman-α analysis under the pulsed spallation source is compared with the average
decay constant done from the previous analysis under a stationary source inherent
in nuclear fuels [2], where the previous three decay constants from three neutron
counters (B1, B2, B3) are averaged to obtain the average and the standard deviation.
Fig. 2.5 Comparison of
respective prompt neutron
decay constants obtained
from Feynman-α analyses
under pulsed spallation and
stationary inherent source
(Ref. [1])