

20
K. Hashimoto
C 8 =
λ d ¯
ν
2
2
6
i = 1
α
2
i Y i
λ f +
m 2 − m
2
1
(−ρ)
m 1 ν (ν − 1) Λ
τ,
(2.26)
α = α 7 .
(2.27)
In this Rossi-α analysis, Eq. (2.22) is fitted to the p(τ )τ data to obtain the
prompt-neutron decay constant α and the four coefficients (C 5 , C 6 , C 7 , C 8 ).
2.1.3 Results and Discussion
2.1.3.1 Feynman-α Analyses
Time-sequence counts data within a time interval (gate time) of 1 ms were generated
from the arriving time data registered, and then the count data within longer gate
times were synthesized by the moving-bunching technique [9] to calculate a gatetime dependence of the Y defined as variance-to-mean ratio minus 1 of the count’s
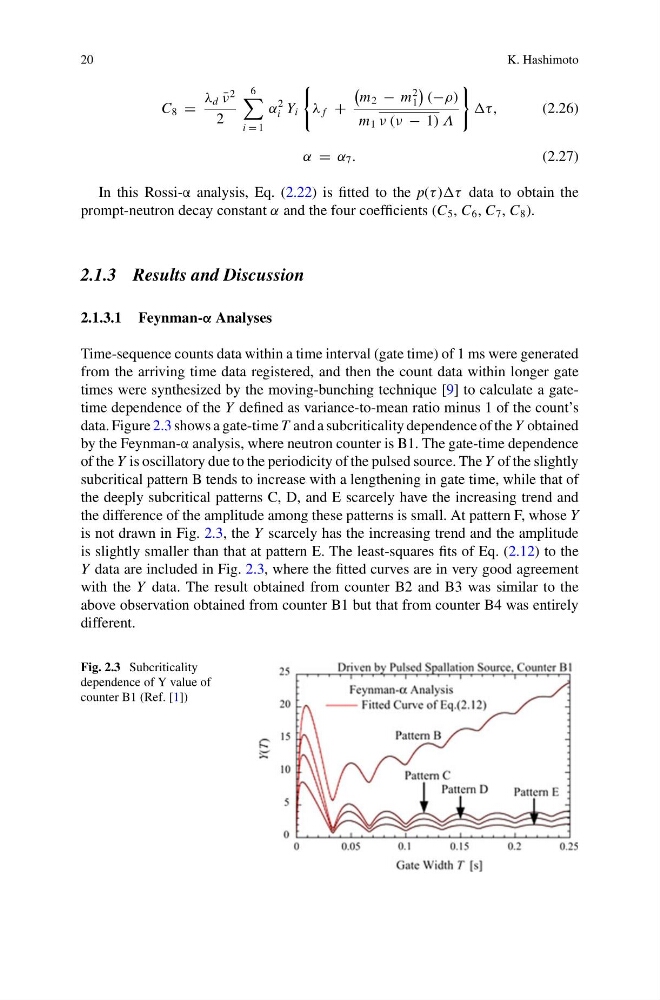
data. Figure 2.3 shows a gate-time T and a subcriticality dependence of the Y obtained
by the Feynman-α analysis, where neutron counter is B1. The gate-time dependence
of the Y is oscillatory due to the periodicity of the pulsed source. The Y of the slightly
subcritical pattern B tends to increase with a lengthening in gate time, while that of
the deeply subcritical patterns C, D, and E scarcely have the increasing trend and
the difference of the amplitude among these patterns is small. At pattern F, whose Y
is not drawn in Fig. 2.3, the Y scarcely has the increasing trend and the amplitude
is slightly smaller than that at pattern E. The least-squares fits of Eq. (2.12) to the
Y data are included in Fig. 2.3, where the fitted curves are in very good agreement
with the Y data. The result obtained from counter B2 and B3 was similar to the
above observation obtained from counter B1 but that from counter B4 was entirely
different.
Fig. 2.3 Subcriticality
dependence of Y value of
counter B1 (Ref. [1])
K. Hashimoto
C 8 =
λ d ¯
ν
2
2
6
i = 1
α
2
i Y i
λ f +
m 2 − m
2
1
(−ρ)
m 1 ν (ν − 1) Λ
τ,
(2.26)
α = α 7 .
(2.27)
In this Rossi-α analysis, Eq. (2.22) is fitted to the p(τ )τ data to obtain the
prompt-neutron decay constant α and the four coefficients (C 5 , C 6 , C 7 , C 8 ).
2.1.3 Results and Discussion
2.1.3.1 Feynman-α Analyses
Time-sequence counts data within a time interval (gate time) of 1 ms were generated
from the arriving time data registered, and then the count data within longer gate
times were synthesized by the moving-bunching technique [9] to calculate a gatetime dependence of the Y defined as variance-to-mean ratio minus 1 of the count’s
data. Figure 2.3 shows a gate-time T and a subcriticality dependence of the Y obtained
by the Feynman-α analysis, where neutron counter is B1. The gate-time dependence
of the Y is oscillatory due to the periodicity of the pulsed source. The Y of the slightly
subcritical pattern B tends to increase with a lengthening in gate time, while that of
the deeply subcritical patterns C, D, and E scarcely have the increasing trend and
the difference of the amplitude among these patterns is small. At pattern F, whose Y
is not drawn in Fig. 2.3, the Y scarcely has the increasing trend and the amplitude
is slightly smaller than that at pattern E. The least-squares fits of Eq. (2.12) to the
Y data are included in Fig. 2.3, where the fitted curves are in very good agreement
with the Y data. The result obtained from counter B2 and B3 was similar to the
above observation obtained from counter B1 but that from counter B4 was entirely
different.
Fig. 2.3 Subcriticality
dependence of Y value of
counter B1 (Ref. [1])