

5 Neutron Spectrum
151
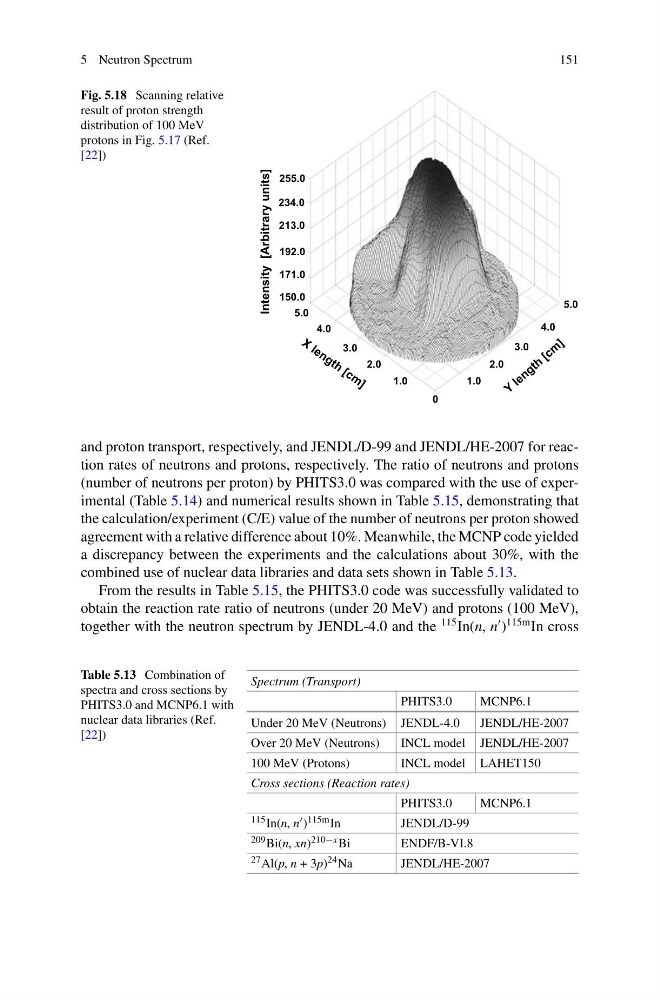
Fig. 5.18 Scanning relative
result of proton strength
distribution of 100 MeV
protons in Fig. 5.17 (Ref.
[22])
5.0
4.0
3.0
0
2.0
1.0
5.0
4.0
2.0
3.0
1.0
150.0
171.0
192.0
213.0
234.0
255.0
Intensity [Arbitrary units]
and proton transport, respectively, and JENDL/D-99 and JENDL/HE-2007 for reaction rates of neutrons and protons, respectively. The ratio of neutrons and protons
(number of neutrons per proton) by PHITS3.0 was compared with the use of experimental (Table 5.14) and numerical results shown in Table 5.15, demonstrating that
the calculation/experiment (C/E) value of the number of neutrons per proton showed
agreement with a relative difference about 10%. Meanwhile, the MCNP code yielded
a discrepancy between the experiments and the calculations about 30%, with the
combined use of nuclear data libraries and data sets shown in Table 5.13.
From the results in Table 5.15, the PHITS3.0 code was successfully validated to
obtain the reaction rate ratio of neutrons (under 20 MeV) and protons (100 MeV),
together with the neutron spectrum by JENDL-4.0 and the
115 In(n, n
)
115m In cross
Table 5.13 Combination of
spectra and cross sections by
PHITS3.0 and MCNP6.1 with
nuclear data libraries (Ref.
[22])
Spectrum (Transport)
PHITS3.0
MCNP6.1
Under 20 MeV (Neutrons) JENDL-4.0
JENDL/HE-2007
Over 20 MeV (Neutrons)
INCL model JENDL/HE-2007
100 MeV (Protons)
INCL model LAHET150
Cross sections (Reaction rates)
PHITS3.0
MCNP6.1
115 In(n, n ) 115m In
JENDL/D-99
209 Bi(n, xn) 210−x Bi
ENDF/B-VI.8
27 Al(p, n + 3p) 24 Na
JENDL/HE-2007
151
Fig. 5.18 Scanning relative
result of proton strength
distribution of 100 MeV
protons in Fig. 5.17 (Ref.
[22])
5.0
4.0
3.0
0
2.0
1.0
5.0
4.0
2.0
3.0
1.0
150.0
171.0
192.0
213.0
234.0
255.0
Intensity [Arbitrary units]
and proton transport, respectively, and JENDL/D-99 and JENDL/HE-2007 for reaction rates of neutrons and protons, respectively. The ratio of neutrons and protons
(number of neutrons per proton) by PHITS3.0 was compared with the use of experimental (Table 5.14) and numerical results shown in Table 5.15, demonstrating that
the calculation/experiment (C/E) value of the number of neutrons per proton showed
agreement with a relative difference about 10%. Meanwhile, the MCNP code yielded
a discrepancy between the experiments and the calculations about 30%, with the
combined use of nuclear data libraries and data sets shown in Table 5.13.
From the results in Table 5.15, the PHITS3.0 code was successfully validated to
obtain the reaction rate ratio of neutrons (under 20 MeV) and protons (100 MeV),
together with the neutron spectrum by JENDL-4.0 and the
115 In(n, n
)
115m In cross
Table 5.13 Combination of
spectra and cross sections by
PHITS3.0 and MCNP6.1 with
nuclear data libraries (Ref.
[22])
Spectrum (Transport)
PHITS3.0
MCNP6.1
Under 20 MeV (Neutrons) JENDL-4.0
JENDL/HE-2007
Over 20 MeV (Neutrons)
INCL model JENDL/HE-2007
100 MeV (Protons)
INCL model LAHET150
Cross sections (Reaction rates)
PHITS3.0
MCNP6.1
115 In(n, n ) 115m In
JENDL/D-99
209 Bi(n, xn) 210−x Bi
ENDF/B-VI.8
27 Al(p, n + 3p) 24 Na
JENDL/HE-2007