

150
C. H. Pyeon
Table 5.12 Threshold energy, half-life and emission γ -ray energy of activation foils (Ref. [22])
Reactions
Threshold energy (MeV) Half-life (T 1/2 ) (h) Emission γ -ray energy
[keV] (Branching ratio
(%))
115 In(n, n ) 115m In
0.3
4.486
336.2 (37.0)
27 Al(p, n + 3p) 24 Na –
15.00
1368.6 (99.9)
numerically obtained by the evaluation of volume tallies of activation foils (In, Bi
and Al foils) within a statistical error of 5%.
5.4.2.3 Number of Neutrons Per Proton
To determine the size of the proton beam spot, the Gafchromic film was attached to
the stainless steel flange downstream of the proton beam path, because a modeling of
the proton beam spot has a significant effect [3, 23] of high-energy neutron generation
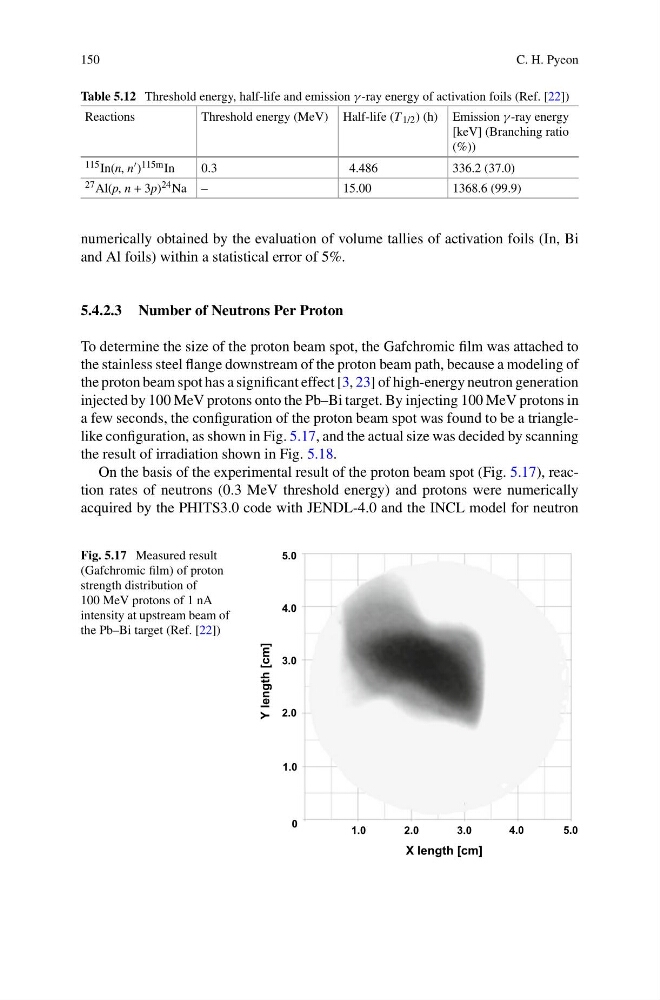
injected by 100 MeV protons onto the Pb–Bi target. By injecting 100 MeV protons in
a few seconds, the configuration of the proton beam spot was found to be a trianglelike configuration, as shown in Fig. 5.17, and the actual size was decided by scanning
the result of irradiation shown in Fig. 5.18.
On the basis of the experimental result of the proton beam spot (Fig. 5.17), reaction rates of neutrons (0.3 MeV threshold energy) and protons were numerically
acquired by the PHITS3.0 code with JENDL-4.0 and the INCL model for neutron
Fig. 5.17 Measured result
(Gafchromic film) of proton
strength distribution of
100 MeV protons of 1 nA
intensity at upstream beam of
the Pb–Bi target (Ref. [22])
5.0
4.0
3.0
2.0
1.0
0
1.0
2.0
3.0
4.0
5.0
X length [cm]
Y length [cm]
C. H. Pyeon
Table 5.12 Threshold energy, half-life and emission γ -ray energy of activation foils (Ref. [22])
Reactions
Threshold energy (MeV) Half-life (T 1/2 ) (h) Emission γ -ray energy
[keV] (Branching ratio
(%))
115 In(n, n ) 115m In
0.3
4.486
336.2 (37.0)
27 Al(p, n + 3p) 24 Na –
15.00
1368.6 (99.9)
numerically obtained by the evaluation of volume tallies of activation foils (In, Bi
and Al foils) within a statistical error of 5%.
5.4.2.3 Number of Neutrons Per Proton
To determine the size of the proton beam spot, the Gafchromic film was attached to
the stainless steel flange downstream of the proton beam path, because a modeling of
the proton beam spot has a significant effect [3, 23] of high-energy neutron generation
injected by 100 MeV protons onto the Pb–Bi target. By injecting 100 MeV protons in
a few seconds, the configuration of the proton beam spot was found to be a trianglelike configuration, as shown in Fig. 5.17, and the actual size was decided by scanning
the result of irradiation shown in Fig. 5.18.
On the basis of the experimental result of the proton beam spot (Fig. 5.17), reaction rates of neutrons (0.3 MeV threshold energy) and protons were numerically
acquired by the PHITS3.0 code with JENDL-4.0 and the INCL model for neutron
Fig. 5.17 Measured result
(Gafchromic film) of proton
strength distribution of
100 MeV protons of 1 nA
intensity at upstream beam of
the Pb–Bi target (Ref. [22])
5.0
4.0
3.0
2.0
1.0
0
1.0
2.0
3.0
4.0
5.0
X length [cm]
Y length [cm]