

144
C. H. Pyeon
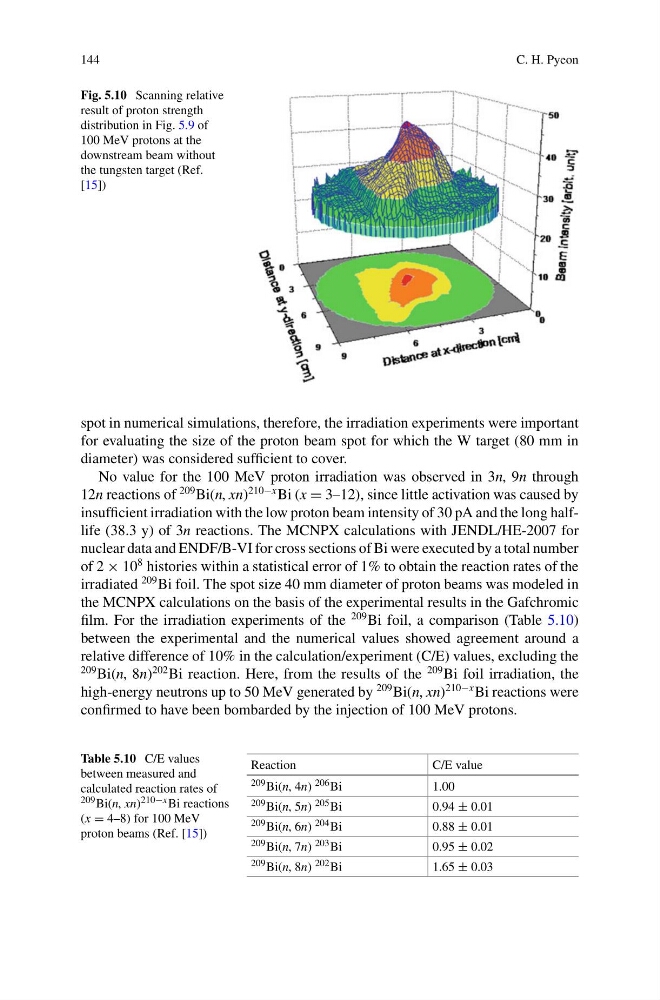
Fig. 5.10 Scanning relative
result of proton strength
distribution in Fig. 5.9 of
100 MeV protons at the
downstream beam without
the tungsten target (Ref.
[15])
spot in numerical simulations, therefore, the irradiation experiments were important
for evaluating the size of the proton beam spot for which the W target (80 mm in
diameter) was considered sufficient to cover.
No value for the 100 MeV proton irradiation was observed in 3n, 9n through
12n reactions of
209 Bi(n, xn)
210−x Bi (x = 3–12), since little activation was caused by
insufficient irradiation with the low proton beam intensity of 30 pA and the long halflife (38.3 y) of 3n reactions. The MCNPX calculations with JENDL/HE-2007 for
nuclear data and ENDF/B-VI for cross sections of Bi were executed by a total number
of 2 × 10
8 histories within a statistical error of 1% to obtain the reaction rates of the
irradiated
209 Bi foil. The spot size 40 mm diameter of proton beams was modeled in
the MCNPX calculations on the basis of the experimental results in the Gafchromic
film. For the irradiation experiments of the
209 Bi foil, a comparison (Table 5.10)
between the experimental and the numerical values showed agreement around a
relative difference of 10% in the calculation/experiment (C/E) values, excluding the
209 Bi(n, 8n)
202 Bi reaction. Here, from the results of the
209 Bi foil irradiation, the
high-energy neutrons up to 50 MeV generated by
209 Bi(n, xn)
210−x Bi reactions were
confirmed to have been bombarded by the injection of 100 MeV protons.
Table 5.10 C/E values
between measured and
calculated reaction rates of
209 Bi(n, xn) 210−x Bi reactions
(x = 4–8) for 100 MeV
proton beams (Ref. [15])
Reaction
C/E value
209 Bi(n, 4n) 206 Bi
1.00
209 Bi(n, 5n) 205 Bi
0.94 ± 0.01
209 Bi(n, 6n) 204 Bi
0.88 ± 0.01
209 Bi(n, 7n) 203 Bi
0.95 ± 0.02
209 Bi(n, 8n) 202 Bi
1.65 ± 0.03
C. H. Pyeon
Fig. 5.10 Scanning relative
result of proton strength
distribution in Fig. 5.9 of
100 MeV protons at the
downstream beam without
the tungsten target (Ref.
[15])
spot in numerical simulations, therefore, the irradiation experiments were important
for evaluating the size of the proton beam spot for which the W target (80 mm in
diameter) was considered sufficient to cover.
No value for the 100 MeV proton irradiation was observed in 3n, 9n through
12n reactions of
209 Bi(n, xn)
210−x Bi (x = 3–12), since little activation was caused by
insufficient irradiation with the low proton beam intensity of 30 pA and the long halflife (38.3 y) of 3n reactions. The MCNPX calculations with JENDL/HE-2007 for
nuclear data and ENDF/B-VI for cross sections of Bi were executed by a total number
of 2 × 10
8 histories within a statistical error of 1% to obtain the reaction rates of the
irradiated
209 Bi foil. The spot size 40 mm diameter of proton beams was modeled in
the MCNPX calculations on the basis of the experimental results in the Gafchromic
film. For the irradiation experiments of the
209 Bi foil, a comparison (Table 5.10)
between the experimental and the numerical values showed agreement around a
relative difference of 10% in the calculation/experiment (C/E) values, excluding the
209 Bi(n, 8n)
202 Bi reaction. Here, from the results of the
209 Bi foil irradiation, the
high-energy neutrons up to 50 MeV generated by
209 Bi(n, xn)
210−x Bi reactions were
confirmed to have been bombarded by the injection of 100 MeV protons.
Table 5.10 C/E values
between measured and
calculated reaction rates of
209 Bi(n, xn) 210−x Bi reactions
(x = 4–8) for 100 MeV
proton beams (Ref. [15])
Reaction
C/E value
209 Bi(n, 4n) 206 Bi
1.00
209 Bi(n, 5n) 205 Bi
0.94 ± 0.01
209 Bi(n, 6n) 204 Bi
0.88 ± 0.01
209 Bi(n, 7n) 203 Bi
0.95 ± 0.02
209 Bi(n, 8n) 202 Bi
1.65 ± 0.03