

5 Neutron Spectrum
143
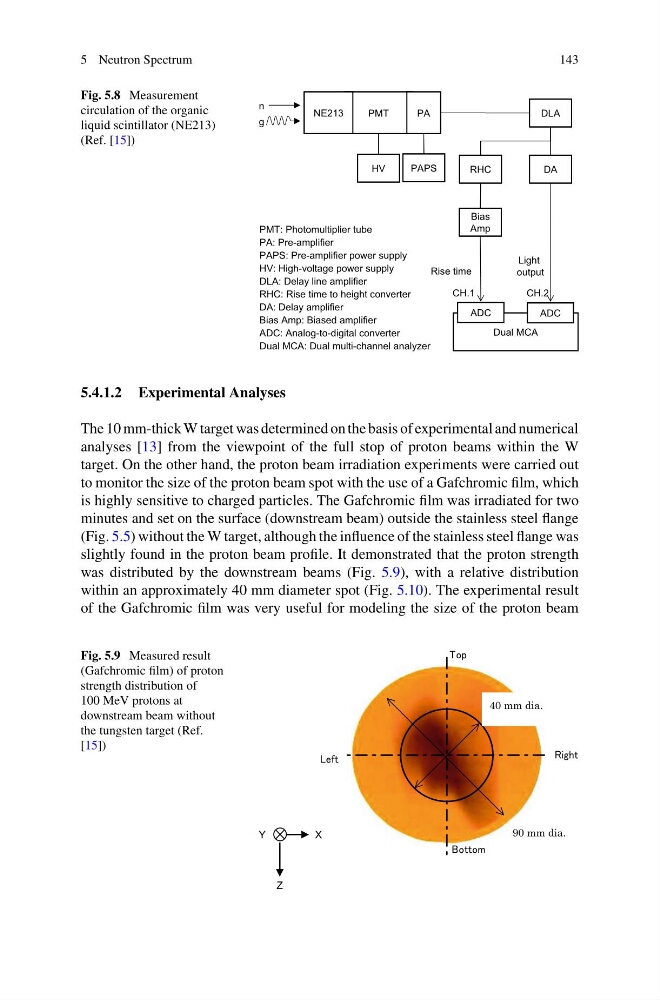
Fig. 5.8 Measurement
circulation of the organic
liquid scintillator (NE213)
(Ref. [15])
PMT
NE213
PA
HV
DLA
RHC
DA
Bias
Amp
Dual MCA
ADC
CH.1
CH.2
n
g
PAPS
Light
output
Rise time
ADC
PMT: Photomultiplier tube
PA: Pre-amplifier
PAPS: Pre-amplifier power supply
HV: High-voltage power supply
DLA: Delay line amplifier
RHC: Rise time to height converter
DA: Delay amplifier
Bias Amp: Biased amplifier
ADC: Analog-to-digital converter
Dual MCA: Dual multi-channel analyzer
5.4.1.2 Experimental Analyses
The 10 mm-thick W target was determined on the basis of experimental and numerical
analyses [13] from the viewpoint of the full stop of proton beams within the W
target. On the other hand, the proton beam irradiation experiments were carried out
to monitor the size of the proton beam spot with the use of a Gafchromic film, which
is highly sensitive to charged particles. The Gafchromic film was irradiated for two
minutes and set on the surface (downstream beam) outside the stainless steel flange
(Fig. 5.5) without the W target, although the influence of the stainless steel flange was
slightly found in the proton beam profile. It demonstrated that the proton strength
was distributed by the downstream beams (Fig. 5.9), with a relative distribution
within an approximately 40 mm diameter spot (Fig. 5.10). The experimental result
of the Gafchromic film was very useful for modeling the size of the proton beam
Fig. 5.9 Measured result
(Gafchromic film) of proton
strength distribution of
100 MeV protons at
downstream beam without
the tungsten target (Ref.
[15])
143
Fig. 5.8 Measurement
circulation of the organic
liquid scintillator (NE213)
(Ref. [15])
PMT
NE213
PA
HV
DLA
RHC
DA
Bias
Amp
Dual MCA
ADC
CH.1
CH.2
n
g
PAPS
Light
output
Rise time
ADC
PMT: Photomultiplier tube
PA: Pre-amplifier
PAPS: Pre-amplifier power supply
HV: High-voltage power supply
DLA: Delay line amplifier
RHC: Rise time to height converter
DA: Delay amplifier
Bias Amp: Biased amplifier
ADC: Analog-to-digital converter
Dual MCA: Dual multi-channel analyzer
5.4.1.2 Experimental Analyses
The 10 mm-thick W target was determined on the basis of experimental and numerical
analyses [13] from the viewpoint of the full stop of proton beams within the W
target. On the other hand, the proton beam irradiation experiments were carried out
to monitor the size of the proton beam spot with the use of a Gafchromic film, which
is highly sensitive to charged particles. The Gafchromic film was irradiated for two
minutes and set on the surface (downstream beam) outside the stainless steel flange
(Fig. 5.5) without the W target, although the influence of the stainless steel flange was
slightly found in the proton beam profile. It demonstrated that the proton strength
was distributed by the downstream beams (Fig. 5.9), with a relative distribution
within an approximately 40 mm diameter spot (Fig. 5.10). The experimental result
of the Gafchromic film was very useful for modeling the size of the proton beam
Fig. 5.9 Measured result
(Gafchromic film) of proton
strength distribution of
100 MeV protons at
downstream beam without
the tungsten target (Ref.
[15])