

94
M. Yamanaka
P U (t 1 , t 2 ) dt 1 dt 2 =P U, const (t 1 , t 2 ) dt 1 dt 2 + P U, trig (t 1 , t 2 ) dt 1 dt 2
=
λ d g ∗ S Λ
√
2 πσ
(− ρ) T 0
dt 1 dt 2
+
λ d g ∗ S (− ρ) T 0
2Λ
√
2 πσ
∞
n = 1
1
α 2 +
2nπ
T 0
2 e
−
2nπ
T 0
2
σ 2
cos
2nπ
T 0
(t 2 − t 1 )
dt 1 dt 2 ,
(4.23)
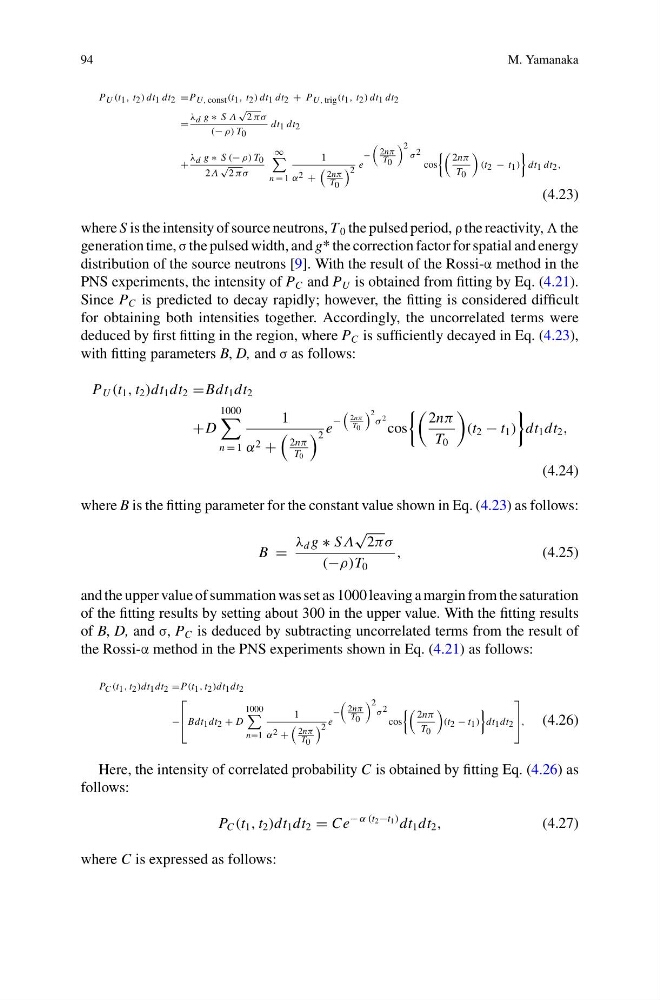
where S is the intensity of source neutrons, T 0 the pulsed period, ρ the reactivity, the
generation time, σ the pulsed width, and g* the correction factor for spatial and energy
distribution of the source neutrons [9]. With the result of the Rossi-α method in the
PNS experiments, the intensity of P C and P U is obtained from fitting by Eq. (4.21).
Since P C is predicted to decay rapidly; however, the fitting is considered difficult
for obtaining both intensities together. Accordingly, the uncorrelated terms were
deduced by first fitting in the region, where P C is sufficiently decayed in Eq. (4.23),
with fitting parameters B, D, and σ as follows:
P U (t 1 , t 2 )dt 1 dt 2 =Bdt 1 dt 2
+D
1000
n = 1
1
α 2 +
2nπ
T 0
2 e
−
2nπ
T 0
2 σ
2
cos
2nπ
T 0
(t 2 − t 1 )
dt 1 dt 2 ,
(4.24)
where B is the fitting parameter for the constant value shown in Eq. (4.23) as follows:
B =
λ d g ∗ SΛ
√
2πσ
(−ρ)T 0
,
(4.25)
and the upper value of summation was set as 1000 leaving a margin from the saturation
of the fitting results by setting about 300 in the upper value. With the fitting results
of B, D, and σ, P C is deduced by subtracting uncorrelated terms from the result of
the Rossi-α method in the PNS experiments shown in Eq. (4.21) as follows:
P C (t 1 , t 2 )dt 1 dt 2 =P(t 1 , t 2 )dt 1 dt 2
−
⎡
⎢
⎣Bdt1dt2 + D
1000
n=1
1
α 2 +
2nπ
T 0
2 e
−
2nπ
T 0
2
σ 2
cos
2nπ
T 0
(t 2 − t 1 )
dt 1 dt 2
⎤
⎥
⎦,
(4.26)
Here, the intensity of correlated probability C is obtained by fitting Eq. (4.26) as
follows:
P C (t 1 , t 2 )dt 1 dt 2 = Ce
− α (t 2 −t 1 ) dt 1 dt 2 ,
(4.27)
where C is expressed as follows:
M. Yamanaka
P U (t 1 , t 2 ) dt 1 dt 2 =P U, const (t 1 , t 2 ) dt 1 dt 2 + P U, trig (t 1 , t 2 ) dt 1 dt 2
=
λ d g ∗ S Λ
√
2 πσ
(− ρ) T 0
dt 1 dt 2
+
λ d g ∗ S (− ρ) T 0
2Λ
√
2 πσ
∞
n = 1
1
α 2 +
2nπ
T 0
2 e
−
2nπ
T 0
2
σ 2
cos
2nπ
T 0
(t 2 − t 1 )
dt 1 dt 2 ,
(4.23)
where S is the intensity of source neutrons, T 0 the pulsed period, ρ the reactivity, the
generation time, σ the pulsed width, and g* the correction factor for spatial and energy
distribution of the source neutrons [9]. With the result of the Rossi-α method in the
PNS experiments, the intensity of P C and P U is obtained from fitting by Eq. (4.21).
Since P C is predicted to decay rapidly; however, the fitting is considered difficult
for obtaining both intensities together. Accordingly, the uncorrelated terms were
deduced by first fitting in the region, where P C is sufficiently decayed in Eq. (4.23),
with fitting parameters B, D, and σ as follows:
P U (t 1 , t 2 )dt 1 dt 2 =Bdt 1 dt 2
+D
1000
n = 1
1
α 2 +
2nπ
T 0
2 e
−
2nπ
T 0
2 σ
2
cos
2nπ
T 0
(t 2 − t 1 )
dt 1 dt 2 ,
(4.24)
where B is the fitting parameter for the constant value shown in Eq. (4.23) as follows:
B =
λ d g ∗ SΛ
√
2πσ
(−ρ)T 0
,
(4.25)
and the upper value of summation was set as 1000 leaving a margin from the saturation
of the fitting results by setting about 300 in the upper value. With the fitting results
of B, D, and σ, P C is deduced by subtracting uncorrelated terms from the result of
the Rossi-α method in the PNS experiments shown in Eq. (4.21) as follows:
P C (t 1 , t 2 )dt 1 dt 2 =P(t 1 , t 2 )dt 1 dt 2
−
⎡
⎢
⎣Bdt1dt2 + D
1000
n=1
1
α 2 +
2nπ
T 0
2 e
−
2nπ
T 0
2
σ 2
cos
2nπ
T 0
(t 2 − t 1 )
dt 1 dt 2
⎤
⎥
⎦,
(4.26)
Here, the intensity of correlated probability C is obtained by fitting Eq. (4.26) as
follows:
P C (t 1 , t 2 )dt 1 dt 2 = Ce
− α (t 2 −t 1 ) dt 1 dt 2 ,
(4.27)
where C is expressed as follows: