

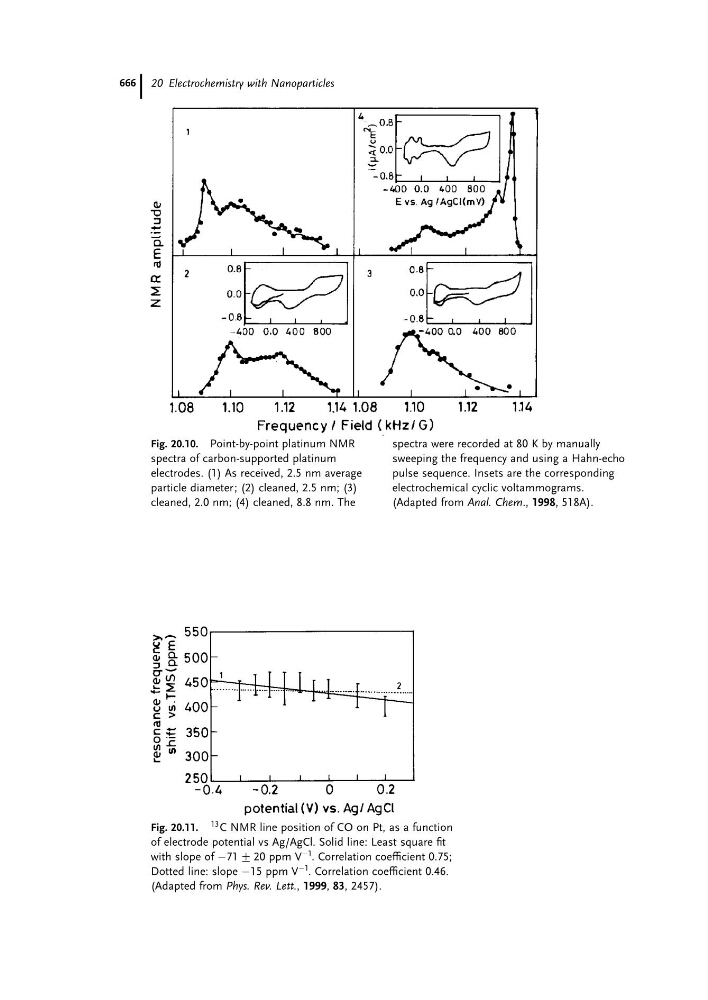
Fig. 20.10. Point-by-point platinum NMR
spectra of carbon-supported platinum
electrodes. (1) As received, 2.5 nm average
particle diameter; (2) cleaned, 2.5 nm; (3)
cleaned, 2.0 nm; (4) cleaned, 8.8 nm. The
spectra were recorded at 80 K by manually
sweeping the frequency and using a Hahn-echo
pulse sequence. Insets are the corresponding
electrochemical cyclic voltammograms.
(Adapted from Anal. Chem., 1998, 518A).
Fig. 20.11.
13 C NMR line position of CO on Pt, as a function
of electrode potential vs Ag/AgCl. Solid line: Least square fit
with slope of À71 G 20 ppm V
À1
. Correlation coefficient 0.75;
Dotted line: slope À15 ppm V
À1
. Correlation coefficient 0.46.
(Adapted from Phys. Rev. Lett., 1999, 83, 2457).
20 Electrochemistry with Nanoparticles
666