

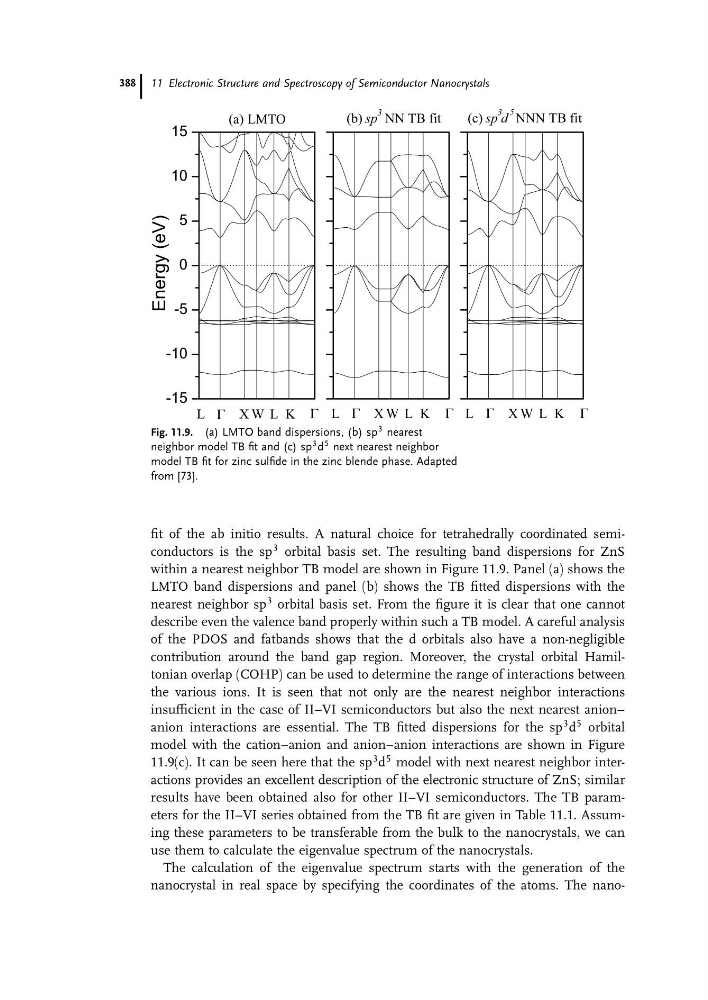
fit of the ab initio results. A natural choice for tetrahedrally coordinated semiconductors is the sp
3 orbital basis set. The resulting band dispersions for ZnS
within a nearest neighbor TB model are shown in Figure 11.9. Panel (a) shows the
LMTO band dispersions and panel (b) shows the TB fitted dispersions with the
nearest neighbor sp
3 orbital basis set. From the figure it is clear that one cannot
describe even the valence band properly within such a TB model. A careful analysis
of the PDOS and fatbands shows that the d orbitals also have a non-negligible
contribution around the band gap region. Moreover, the crystal orbital Hamiltonian overlap (COHP) can be used to determine the range of interactions between
the various ions. It is seen that not only are the nearest neighbor interactions
insufficient in the case of II–VI semiconductors but also the next nearest anion–
anion interactions are essential. The TB fitted dispersions for the sp
3 d
5 orbital
model with the cation–anion and anion–anion interactions are shown in Figure
11.9(c). It can be seen here that the sp
3 d
5 model with next nearest neighbor interactions provides an excellent description of the electronic structure of ZnS; similar
results have been obtained also for other II–VI semiconductors. The TB parameters for the II–VI series obtained from the TB fit are given in Table 11.1. Assuming these parameters to be transferable from the bulk to the nanocrystals, we can
use them to calculate the eigenvalue spectrum of the nanocrystals.
The calculation of the eigenvalue spectrum starts with the generation of the
nanocrystal in real space by specifying the coordinates of the atoms. The nano-15
-10
-5
0
5
10
15
(a) LMTO
Energy (eV)
K
L
W
X
L
K
L
W
X
L
K
L
W
X
L
(b) sp
3 NN TB fit
(c) sp
3
d
5 NNN TB fit
G
G
G
G
G
G
Fig. 11.9. (a) LMTO band dispersions, (b) sp
3 nearest
neighbor model TB fit and (c) sp
3 d
5 next nearest neighbor
model TB fit for zinc sulfide in the zinc blende phase. Adapted
from [73].
11 Electronic Structure and Spectroscopy of Semiconductor Nanocrystals
388
3 orbital basis set. The resulting band dispersions for ZnS
within a nearest neighbor TB model are shown in Figure 11.9. Panel (a) shows the
LMTO band dispersions and panel (b) shows the TB fitted dispersions with the
nearest neighbor sp
3 orbital basis set. From the figure it is clear that one cannot
describe even the valence band properly within such a TB model. A careful analysis
of the PDOS and fatbands shows that the d orbitals also have a non-negligible
contribution around the band gap region. Moreover, the crystal orbital Hamiltonian overlap (COHP) can be used to determine the range of interactions between
the various ions. It is seen that not only are the nearest neighbor interactions
insufficient in the case of II–VI semiconductors but also the next nearest anion–
anion interactions are essential. The TB fitted dispersions for the sp
3 d
5 orbital
model with the cation–anion and anion–anion interactions are shown in Figure
11.9(c). It can be seen here that the sp
3 d
5 model with next nearest neighbor interactions provides an excellent description of the electronic structure of ZnS; similar
results have been obtained also for other II–VI semiconductors. The TB parameters for the II–VI series obtained from the TB fit are given in Table 11.1. Assuming these parameters to be transferable from the bulk to the nanocrystals, we can
use them to calculate the eigenvalue spectrum of the nanocrystals.
The calculation of the eigenvalue spectrum starts with the generation of the
nanocrystal in real space by specifying the coordinates of the atoms. The nano-15
-10
-5
0
5
10
15
(a) LMTO
Energy (eV)
K
L
W
X
L
K
L
W
X
L
K
L
W
X
L
(b) sp
3 NN TB fit
(c) sp
3
d
5 NNN TB fit
G
G
G
G
G
G
Fig. 11.9. (a) LMTO band dispersions, (b) sp
3 nearest
neighbor model TB fit and (c) sp
3 d
5 next nearest neighbor
model TB fit for zinc sulfide in the zinc blende phase. Adapted
from [73].
11 Electronic Structure and Spectroscopy of Semiconductor Nanocrystals
388