

observe a significant shift of the peaks in the Raman spectrum of SWNTs upon
immersion in liquids. This allows the use of nanotubes as molecular sensors. Kong
et al. [176a] have measured the sensitivity of the electron transport properties of
SWNTs to gaseous molecules such as NO 2 or NH 3 . The nanotubes exhibit faster
response and a higher sensitivity than the available solid state sensors at room
temperature; there is also good sensor reversibility. Ghosh et al. [176b] have reported that the flow of a liquid on single-walled carbon nanotube bundles induces
a voltage/current in the sample along the direction of the flow. They found that the
voltage so produced fits a logarithmic velocity dependence over nearly six decades
of velocity. The magnitude of the voltage/current depends sensitively on the ionic
conductivity and the polar nature of the liquid. Their measurements suggest that
the dominant mechanism responsible for this highly nonlinear response should
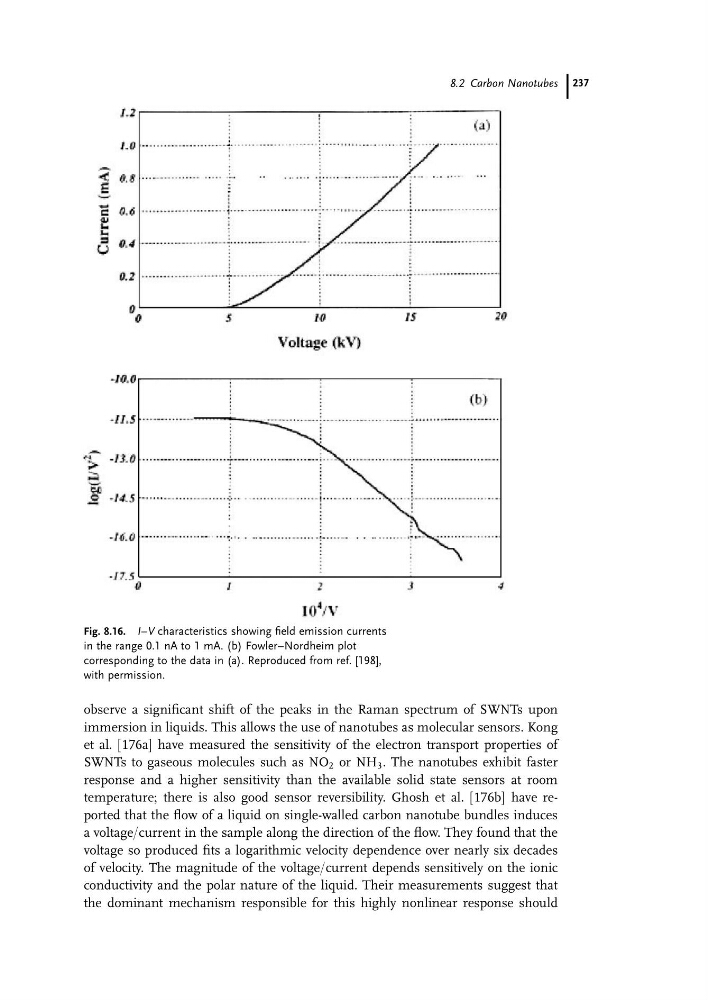
Fig. 8.16. I–V characteristics showing field emission currents
in the range 0.1 nA to 1 mA. (b) Fowler–Nordheim plot
corresponding to the data in (a). Reproduced from ref. [198],
with permission.
8.2 Carbon Nanotubes 237
immersion in liquids. This allows the use of nanotubes as molecular sensors. Kong
et al. [176a] have measured the sensitivity of the electron transport properties of
SWNTs to gaseous molecules such as NO 2 or NH 3 . The nanotubes exhibit faster
response and a higher sensitivity than the available solid state sensors at room
temperature; there is also good sensor reversibility. Ghosh et al. [176b] have reported that the flow of a liquid on single-walled carbon nanotube bundles induces
a voltage/current in the sample along the direction of the flow. They found that the
voltage so produced fits a logarithmic velocity dependence over nearly six decades
of velocity. The magnitude of the voltage/current depends sensitively on the ionic
conductivity and the polar nature of the liquid. Their measurements suggest that
the dominant mechanism responsible for this highly nonlinear response should
Fig. 8.16. I–V characteristics showing field emission currents
in the range 0.1 nA to 1 mA. (b) Fowler–Nordheim plot
corresponding to the data in (a). Reproduced from ref. [198],
with permission.
8.2 Carbon Nanotubes 237