

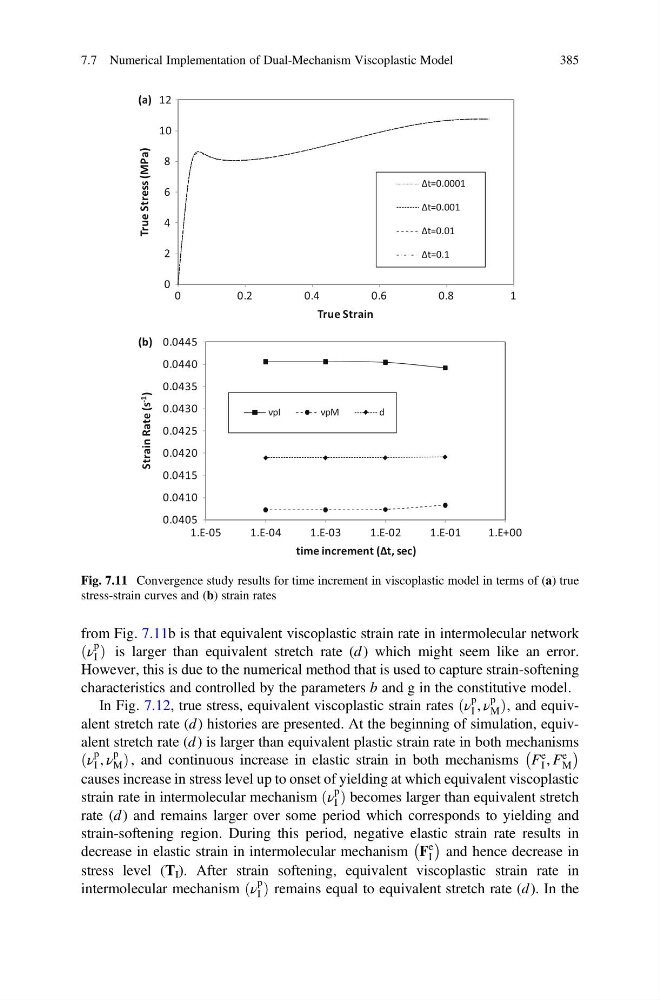
from Fig. 7.11b is that equivalent viscoplastic strain rate in intermolecular network
ν
p
I
ð Þ is larger than equivalent stretch rate (d ) which might seem like an error.
However, this is due to the numerical method that is used to capture strain-softening
characteristics and controlled by the parameters b and g in the constitutive model.
In Fig. 7.12, true stress, equivalent viscoplastic strain rates ν
p
I , ν
p
M
ð
Þ, and equivalent stretch rate (d ) histories are presented. At the beginning of simulation, equivalent stretch rate (d ) is larger than equivalent plastic strain rate in both mechanisms
ν
p
I , ν
p
M
ð
Þ, and continuous increase in elastic strain in both mechanisms F
e
I , F
e
M
À
Á
causes increase in stress level up to onset of yielding at which equivalent viscoplastic
strain rate in intermolecular mechanism ν
p
I
ð Þ becomes larger than equivalent stretch
rate (d) and remains larger over some period which corresponds to yielding and
strain-softening region. During this period, negative elastic strain rate results in
decrease in elastic strain in intermolecular mechanism F
e
I
À Á
and hence decrease in
stress level (T I ). After strain softening, equivalent viscoplastic strain rate in
intermolecular mechanism ν
p
I
ð Þ remains equal to equivalent stretch rate (d). In the
0
2
4
6
8
10
12
0
0.2
0.4
0.6
0.8
1
True Stress (MPa)
True Strain
Δt=0.0001
Δt=0.001
Δt=0.01
Δt=0.1
(a)
0.0405
0.0410
0.0415
0.0420
0.0425
0.0430
0.0435
0.0440
0.0445
1.E-05
1.E-04
1.E-03
1.E-02
1.E-01
1.E+00
Strain Rate (s -1
)
time increment (Δt, sec)
νpI
νpM
d
(b)
Fig. 7.11 Convergence study results for time increment in viscoplastic model in terms of (a) true
stress-strain curves and (b) strain rates
7.7 Numerical Implementation of Dual-Mechanism Viscoplastic Model
385
ν
p
I
ð Þ is larger than equivalent stretch rate (d ) which might seem like an error.
However, this is due to the numerical method that is used to capture strain-softening
characteristics and controlled by the parameters b and g in the constitutive model.
In Fig. 7.12, true stress, equivalent viscoplastic strain rates ν
p
I , ν
p
M
ð
Þ, and equivalent stretch rate (d ) histories are presented. At the beginning of simulation, equivalent stretch rate (d ) is larger than equivalent plastic strain rate in both mechanisms
ν
p
I , ν
p
M
ð
Þ, and continuous increase in elastic strain in both mechanisms F
e
I , F
e
M
À
Á
causes increase in stress level up to onset of yielding at which equivalent viscoplastic
strain rate in intermolecular mechanism ν
p
I
ð Þ becomes larger than equivalent stretch
rate (d) and remains larger over some period which corresponds to yielding and
strain-softening region. During this period, negative elastic strain rate results in
decrease in elastic strain in intermolecular mechanism F
e
I
À Á
and hence decrease in
stress level (T I ). After strain softening, equivalent viscoplastic strain rate in
intermolecular mechanism ν
p
I
ð Þ remains equal to equivalent stretch rate (d). In the
0
2
4
6
8
10
12
0
0.2
0.4
0.6
0.8
1
True Stress (MPa)
True Strain
Δt=0.0001
Δt=0.001
Δt=0.01
Δt=0.1
(a)
0.0405
0.0410
0.0415
0.0420
0.0425
0.0430
0.0435
0.0440
0.0445
1.E-05
1.E-04
1.E-03
1.E-02
1.E-01
1.E+00
Strain Rate (s -1
)
time increment (Δt, sec)
νpI
νpM
d
(b)
Fig. 7.11 Convergence study results for time increment in viscoplastic model in terms of (a) true
stress-strain curves and (b) strain rates
7.7 Numerical Implementation of Dual-Mechanism Viscoplastic Model
385