

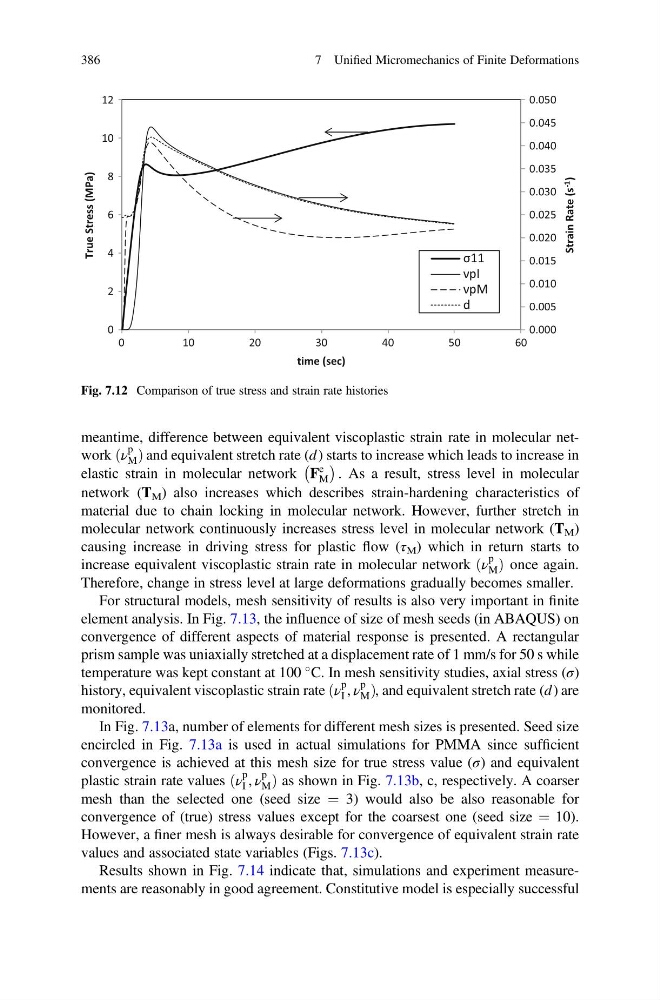
meantime, difference between equivalent viscoplastic strain rate in molecular network ν
p
M
ð Þand equivalent stretch rate (d) starts to increase which leads to increase in
elastic strain in molecular network F
e
M
À Á
. As a result, stress level in molecular
network (T M ) also increases which describes strain-hardening characteristics of
material due to chain locking in molecular network. However, further stretch in
molecular network continuously increases stress level in molecular network (T M )
causing increase in driving stress for plastic flow (τ M ) which in return starts to
increase equivalent viscoplastic strain rate in molecular network ν
p
M
ð Þ once again.
Therefore, change in stress level at large deformations gradually becomes smaller.
For structural models, mesh sensitivity of results is also very important in finite
element analysis. In Fig. 7.13, the influence of size of mesh seeds (in ABAQUS) on
convergence of different aspects of material response is presented. A rectangular
prism sample was uniaxially stretched at a displacement rate of 1 mm/s for 50 s while
temperature was kept constant at 100
C. In mesh sensitivity studies, axial stress (σ)
history, equivalent viscoplastic strain rate ν
p
I , ν
p
M
ð
Þ , and equivalent stretch rate (d) are
monitored.
In Fig. 7.13a, number of elements for different mesh sizes is presented. Seed size
encircled in Fig. 7.13a is used in actual simulations for PMMA since sufficient
convergence is achieved at this mesh size for true stress value (σ) and equivalent
plastic strain rate values ν
p
I , ν
p
M
ð
Þas shown in Fig. 7.13b, c, respectively. A coarser
mesh than the selected one (seed size ¼ 3) would also be also reasonable for
convergence of (true) stress values except for the coarsest one (seed size ¼ 10).
However, a finer mesh is always desirable for convergence of equivalent strain rate
values and associated state variables (Figs. 7.13c).
Results shown in Fig. 7.14 indicate that, simulations and experiment measurements are reasonably in good agreement. Constitutive model is especially successful
0.000
0.005
0.010
0.015
0.020
0.025
0.030
0.035
0.040
0.045
0.050
0
2
4
6
8
10
12
0
1 0
2 0
3 0
4 0
5 0
6 0
Strain Rate (s -1
)
True Stress (MPa)
time (sec)
σ11
νpI
νpM
d
Fig. 7.12 Comparison of true stress and strain rate histories
386
7 Unified Micromechanics of Finite Deformations
p
M
ð Þand equivalent stretch rate (d) starts to increase which leads to increase in
elastic strain in molecular network F
e
M
À Á
. As a result, stress level in molecular
network (T M ) also increases which describes strain-hardening characteristics of
material due to chain locking in molecular network. However, further stretch in
molecular network continuously increases stress level in molecular network (T M )
causing increase in driving stress for plastic flow (τ M ) which in return starts to
increase equivalent viscoplastic strain rate in molecular network ν
p
M
ð Þ once again.
Therefore, change in stress level at large deformations gradually becomes smaller.
For structural models, mesh sensitivity of results is also very important in finite
element analysis. In Fig. 7.13, the influence of size of mesh seeds (in ABAQUS) on
convergence of different aspects of material response is presented. A rectangular
prism sample was uniaxially stretched at a displacement rate of 1 mm/s for 50 s while
temperature was kept constant at 100
C. In mesh sensitivity studies, axial stress (σ)
history, equivalent viscoplastic strain rate ν
p
I , ν
p
M
ð
Þ , and equivalent stretch rate (d) are
monitored.
In Fig. 7.13a, number of elements for different mesh sizes is presented. Seed size
encircled in Fig. 7.13a is used in actual simulations for PMMA since sufficient
convergence is achieved at this mesh size for true stress value (σ) and equivalent
plastic strain rate values ν
p
I , ν
p
M
ð
Þas shown in Fig. 7.13b, c, respectively. A coarser
mesh than the selected one (seed size ¼ 3) would also be also reasonable for
convergence of (true) stress values except for the coarsest one (seed size ¼ 10).
However, a finer mesh is always desirable for convergence of equivalent strain rate
values and associated state variables (Figs. 7.13c).
Results shown in Fig. 7.14 indicate that, simulations and experiment measurements are reasonably in good agreement. Constitutive model is especially successful
0.000
0.005
0.010
0.015
0.020
0.025
0.030
0.035
0.040
0.045
0.050
0
2
4
6
8
10
12
0
1 0
2 0
3 0
4 0
5 0
6 0
Strain Rate (s -1
)
True Stress (MPa)
time (sec)
σ11
νpI
νpM
d
Fig. 7.12 Comparison of true stress and strain rate histories
386
7 Unified Micromechanics of Finite Deformations