

It is normally assumed that, when plastic flow occurs, plastic rate is equal to total
strain rate. Since PMMA displays brittle failure under tension at low temperatures
without pronounced yielding, data set for Eyring plots are limited. A master curve
can be constructed by shifting data set horizontally and vertically to a reference
temperature (θ
ref ) as defined as
Δ log ν
p
I
ð Þ
ð
Þ¼H h
1
θ
À
1
θ
ref
ð7:237Þ
Δ
σ y
θ
¼ H v
1
θ
À
1
θ
ref
ð7:238Þ
According to Richeton et al. (2005a, b), if θ
ref is selected as θ g , horizontal shift
(H h ) and vertical shift (H v ) factors can be related to material properties through the
following relation:
H h ¼
Q I
k B ln 10
ð Þ
ð7:239Þ
H v ¼ B g À X
g
B θ g ¼
γ
3
ð7:240Þ
where Q I is the activation energy for plastic flow in intermolecular structure, k B is
Boltzmann’s constant, B g and X
g
B are parameters for bulk modulus, and γ is the
parameter characterizing dynamic recovery in hardening characteristics of
intermolecular structure. Equation for master curve can be derived from plastic
flow rule in intermolecular structure (Eq. (7.174)) as follows:
-3.5
-3
-2.5
-2
-1.5
-1
-0.5
0
0.005
0.01
0.015
0.02
0.025
0.03
0.035
0.04
0.045
σ
y
/θ [MPa/K]
log(ν
p ) [s
-1 ]
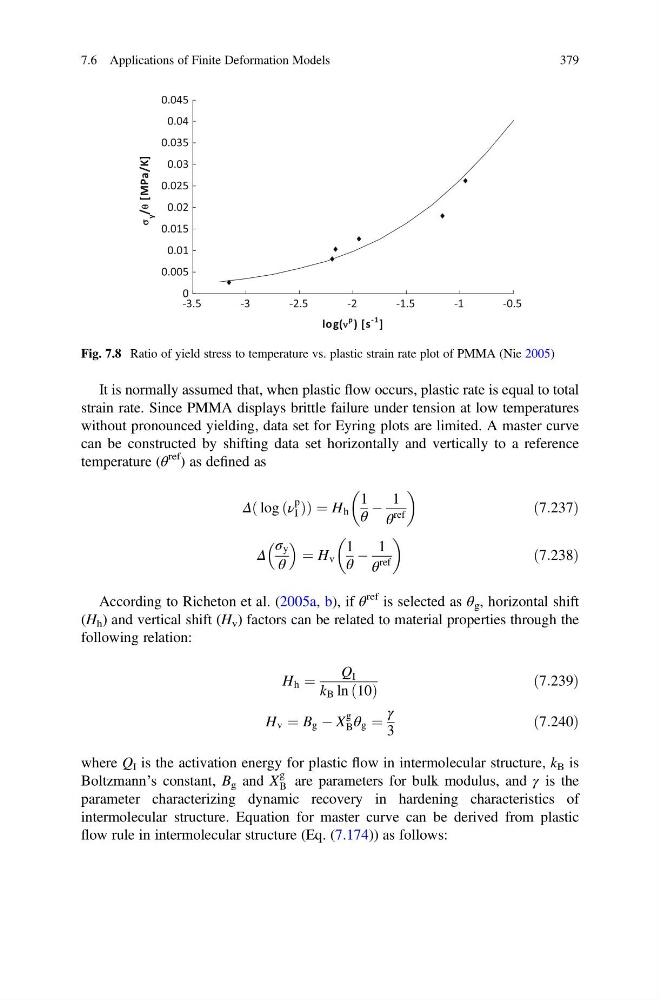
Fig. 7.8 Ratio of yield stress to temperature vs. plastic strain rate plot of PMMA (Nie 2005)
7.6 Applications of Finite Deformation Models
379
strain rate. Since PMMA displays brittle failure under tension at low temperatures
without pronounced yielding, data set for Eyring plots are limited. A master curve
can be constructed by shifting data set horizontally and vertically to a reference
temperature (θ
ref ) as defined as
Δ log ν
p
I
ð Þ
ð
Þ¼H h
1
θ
À
1
θ
ref
ð7:237Þ
Δ
σ y
θ
¼ H v
1
θ
À
1
θ
ref
ð7:238Þ
According to Richeton et al. (2005a, b), if θ
ref is selected as θ g , horizontal shift
(H h ) and vertical shift (H v ) factors can be related to material properties through the
following relation:
H h ¼
Q I
k B ln 10
ð Þ
ð7:239Þ
H v ¼ B g À X
g
B θ g ¼
γ
3
ð7:240Þ
where Q I is the activation energy for plastic flow in intermolecular structure, k B is
Boltzmann’s constant, B g and X
g
B are parameters for bulk modulus, and γ is the
parameter characterizing dynamic recovery in hardening characteristics of
intermolecular structure. Equation for master curve can be derived from plastic
flow rule in intermolecular structure (Eq. (7.174)) as follows:
-3.5
-3
-2.5
-2
-1.5
-1
-0.5
0
0.005
0.01
0.015
0.02
0.025
0.03
0.035
0.04
0.045
σ
y
/θ [MPa/K]
log(ν
p ) [s
-1 ]
Fig. 7.8 Ratio of yield stress to temperature vs. plastic strain rate plot of PMMA (Nie 2005)
7.6 Applications of Finite Deformation Models
379