

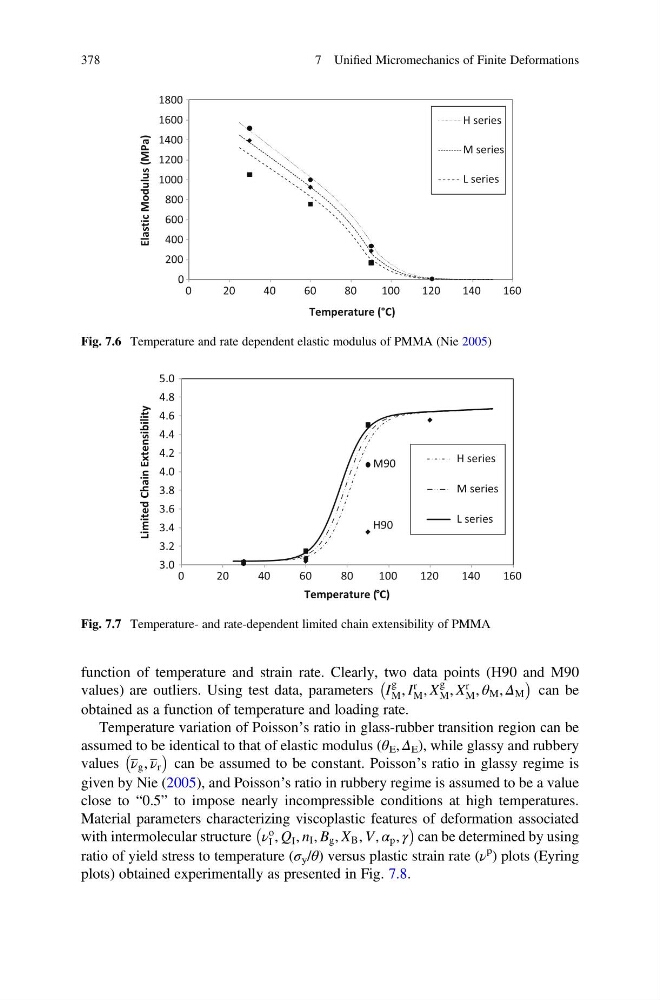
function of temperature and strain rate. Clearly, two data points (H90 and M90
values) are outliers. Using test data, parameters I
g
M , I
r
M , X
g
M , X
r
M , θ M , Δ M
À
Á
can be
obtained as a function of temperature and loading rate.
Temperature variation of Poisson’s ratio in glass-rubber transition region can be
assumed to be identical to that of elastic modulus (θ E , Δ E ), while glassy and rubbery
values ν g , ν r
À
Á
can be assumed to be constant. Poisson’s ratio in glassy regime is
given by Nie (2005), and Poisson’s ratio in rubbery regime is assumed to be a value
close to “0.5” to impose nearly incompressible conditions at high temperatures.
Material parameters characterizing viscoplastic features of deformation associated
with intermolecular structure ν
o
I , Q I , n I , B g , X B , V, α p , γ
À
Á
can be determined by using
ratio of yield stress to temperature (σ y /θ) versus plastic strain rate (ν
p ) plots (Eyring
plots) obtained experimentally as presented in Fig. 7.8.
0
200
400
600
800
1000
1200
1400
1600
1800
0
20
40
60
80
100
120
140
160
Elastic Modulus (MPa)
Temperature (°C)
H series
M series
L series
Fig. 7.6 Temperature and rate dependent elastic modulus of PMMA (Nie 2005)
3.0
3.2
3.4
3.6
3.8
4.0
4.2
4.4
4.6
4.8
5.0
0
20
40
60
80
100
120
140
160
Limited Chain Extensibility
Temperature (°C)
H series
M series
L series
H90
M90
Fig. 7.7 Temperature- and rate-dependent limited chain extensibility of PMMA
378
7 Unified Micromechanics of Finite Deformations
values) are outliers. Using test data, parameters I
g
M , I
r
M , X
g
M , X
r
M , θ M , Δ M
À
Á
can be
obtained as a function of temperature and loading rate.
Temperature variation of Poisson’s ratio in glass-rubber transition region can be
assumed to be identical to that of elastic modulus (θ E , Δ E ), while glassy and rubbery
values ν g , ν r
À
Á
can be assumed to be constant. Poisson’s ratio in glassy regime is
given by Nie (2005), and Poisson’s ratio in rubbery regime is assumed to be a value
close to “0.5” to impose nearly incompressible conditions at high temperatures.
Material parameters characterizing viscoplastic features of deformation associated
with intermolecular structure ν
o
I , Q I , n I , B g , X B , V, α p , γ
À
Á
can be determined by using
ratio of yield stress to temperature (σ y /θ) versus plastic strain rate (ν
p ) plots (Eyring
plots) obtained experimentally as presented in Fig. 7.8.
0
200
400
600
800
1000
1200
1400
1600
1800
0
20
40
60
80
100
120
140
160
Elastic Modulus (MPa)
Temperature (°C)
H series
M series
L series
Fig. 7.6 Temperature and rate dependent elastic modulus of PMMA (Nie 2005)
3.0
3.2
3.4
3.6
3.8
4.0
4.2
4.4
4.6
4.8
5.0
0
20
40
60
80
100
120
140
160
Limited Chain Extensibility
Temperature (°C)
H series
M series
L series
H90
M90
Fig. 7.7 Temperature- and rate-dependent limited chain extensibility of PMMA
378
7 Unified Micromechanics of Finite Deformations