

treated in the same way as before. Figure 4.12 shows the stress-strain diagram
obtained from monotonic tension tests. Figure 4.13 presents the evolution of the
TSI for the specimen. TSI starts from zero and reaches one at the end. We can see
that the TSI remains very small for a while before it starts to increase. This domain
corresponds to the elastic range of the material. In fact, because we assumed that
only plastic deformation could cause degradation in the material, there is no entropy
generated in the elastic range according our assumption.
As of this writing, there is a recent special issue of journal of Entropy dedicated to
this topic. The journal has excellent examples where readers can download the
papers free of charge
https://www.mdpi.com/journal/entropy/special_issues/fatigue
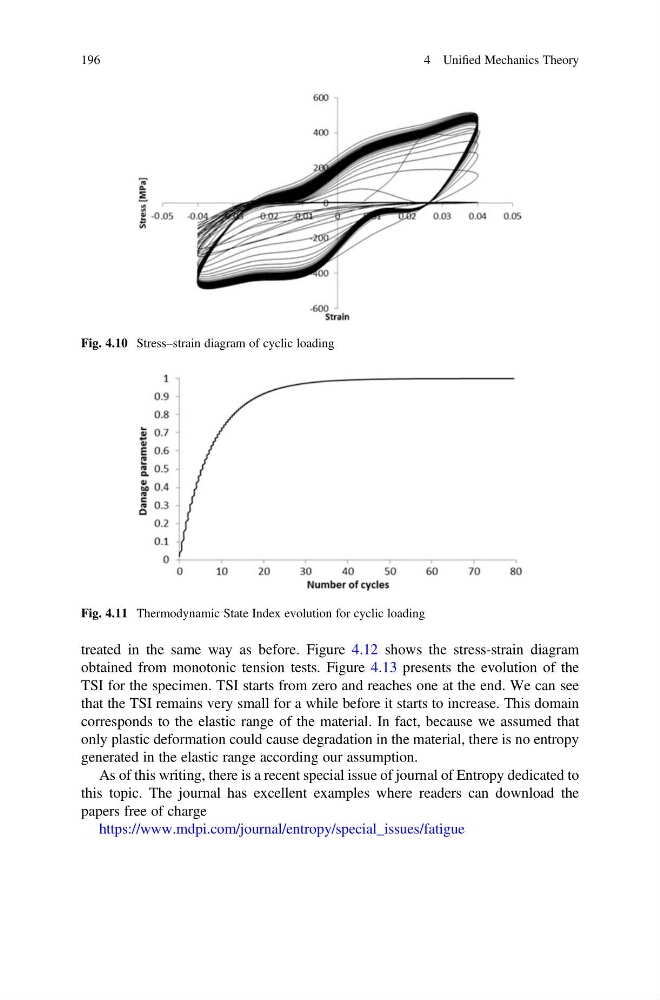
Fig. 4.10 Stress–strain diagram of cyclic loading
Fig. 4.11 Thermodynamic State Index evolution for cyclic loading
196
4 Unified Mechanics Theory
obtained from monotonic tension tests. Figure 4.13 presents the evolution of the
TSI for the specimen. TSI starts from zero and reaches one at the end. We can see
that the TSI remains very small for a while before it starts to increase. This domain
corresponds to the elastic range of the material. In fact, because we assumed that
only plastic deformation could cause degradation in the material, there is no entropy
generated in the elastic range according our assumption.
As of this writing, there is a recent special issue of journal of Entropy dedicated to
this topic. The journal has excellent examples where readers can download the
papers free of charge
https://www.mdpi.com/journal/entropy/special_issues/fatigue
Fig. 4.10 Stress–strain diagram of cyclic loading
Fig. 4.11 Thermodynamic State Index evolution for cyclic loading
196
4 Unified Mechanics Theory