

14.6 Optical Time-Domain Reflectometer
597
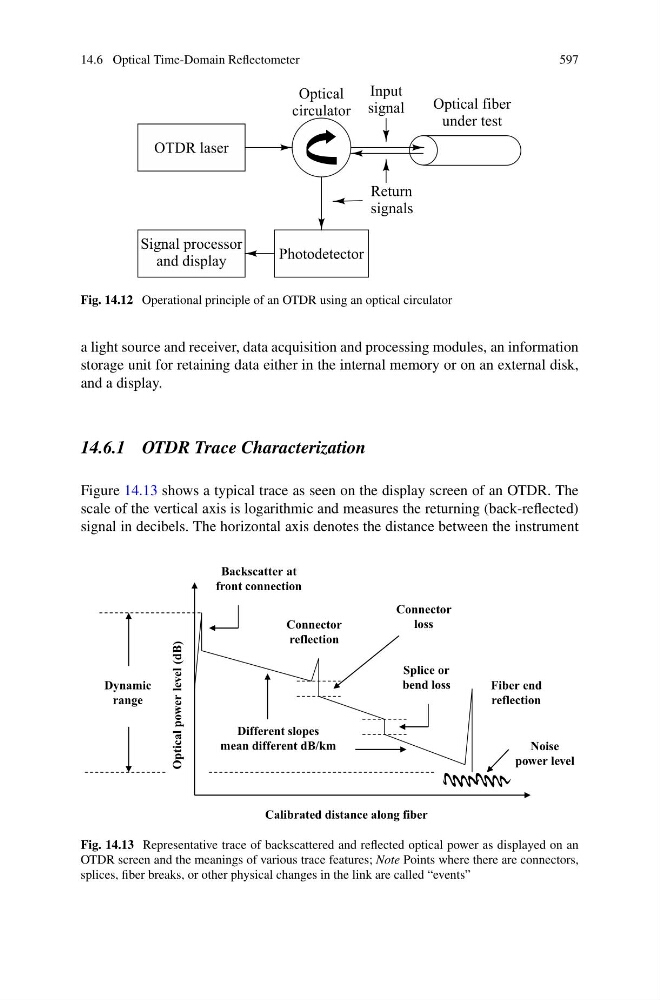
Fig. 14.12 Operational principle of an OTDR using an optical circulator
a light source and receiver, data acquisition and processing modules, an information
storage unit for retaining data either in the internal memory or on an external disk,
and a display.
14.6.1 OTDR Trace Characterization
Figure 14.13 shows a typical trace as seen on the display screen of an OTDR. The
scale of the vertical axis is logarithmic and measures the returning (back-reflected)
signal in decibels. The horizontal axis denotes the distance between the instrument
Dynamic
range
Noise
power level
Backscatter at
front connection
Optical power level (dB)
Calibrated distance along fiber
Connector
loss
Splice or
bend loss
Connector
reflection
Fiber end
reflection
Different slopes
mean different dB/km
Fig. 14.13 Representative trace of backscattered and reflected optical power as displayed on an
OTDR screen and the meanings of various trace features; Note Points where there are connectors,
splices, fiber breaks, or other physical changes in the link are called “events”