

11.4 Noises Generated in Optical Amplifiers
457
σ
2
s−AS E = 4
RGP s,in
(RS ASE B e )
(11.28)
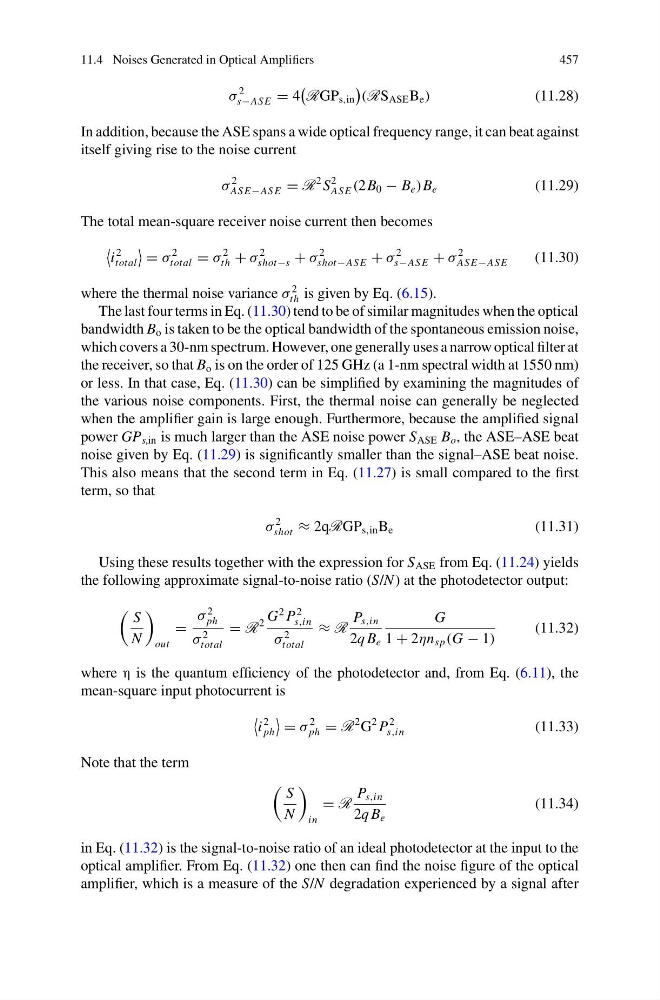
In addition, because the ASE spans a wide optical frequency range, it can beat against
itself giving rise to the noise current
σ
2
AS E−AS E = R
2 S
2
AS E (2B 0 − B e )B e
(11.29)
The total mean-square receiver noise current then becomes
i
2
total
= σ
2
total = σ
2
th + σ
2
shot−s + σ
2
shot−AS E + σ
2
s−AS E + σ
2
AS E−AS E
(11.30)
where the thermal noise variance σ
2
th is given by Eq. (6.15).
The last four terms in Eq. (11.30) tend to be of similar magnitudes when the optical
bandwidth B o is taken to be the optical bandwidth of the spontaneous emission noise,
which covers a 30-nm spectrum. However, one generally uses a narrow optical filter at
the receiver, so that B o is on the order of 125 GHz (a 1-nm spectral width at 1550 nm)
or less. In that case, Eq. (11.30) can be simplified by examining the magnitudes of
the various noise components. First, the thermal noise can generally be neglected
when the amplifier gain is large enough. Furthermore, because the amplified signal
power GP s,in is much larger than the ASE noise power S ASE B o , the ASE–ASE beat
noise given by Eq. (11.29) is significantly smaller than the signal–ASE beat noise.
This also means that the second term in Eq. (11.27) is small compared to the first
term, so that
σ
2
shot ≈ 2qRGP s,in B e
(11.31)
Using these results together with the expression for S ASE from Eq. (11.24) yields
the following approximate signal-to-noise ratio (S/N) at the photodetector output:
S
N
out
=
σ
2
ph
σ
2
total
= R
2
G
2 P
2
s,in
σ
2
total
≈ R
P s,in
2q B e
G
1 + 2ηn sp (G − 1)
(11.32)
where η is the quantum efficiency of the photodetector and, from Eq. (6.11), the
mean-square input photocurrent is
i
2
ph
= σ
2
ph = R
2 G
2 P
2
s,in
(11.33)
Note that the term
S
N
in
= R
P s,in
2q B e
(11.34)
in Eq. (11.32) is the signal-to-noise ratio of an ideal photodetector at the input to the
optical amplifier. From Eq. (11.32) one then can find the noise figure of the optical
amplifier, which is a measure of the S/N degradation experienced by a signal after
457
σ
2
s−AS E = 4
RGP s,in
(RS ASE B e )
(11.28)
In addition, because the ASE spans a wide optical frequency range, it can beat against
itself giving rise to the noise current
σ
2
AS E−AS E = R
2 S
2
AS E (2B 0 − B e )B e
(11.29)
The total mean-square receiver noise current then becomes
i
2
total
= σ
2
total = σ
2
th + σ
2
shot−s + σ
2
shot−AS E + σ
2
s−AS E + σ
2
AS E−AS E
(11.30)
where the thermal noise variance σ
2
th is given by Eq. (6.15).
The last four terms in Eq. (11.30) tend to be of similar magnitudes when the optical
bandwidth B o is taken to be the optical bandwidth of the spontaneous emission noise,
which covers a 30-nm spectrum. However, one generally uses a narrow optical filter at
the receiver, so that B o is on the order of 125 GHz (a 1-nm spectral width at 1550 nm)
or less. In that case, Eq. (11.30) can be simplified by examining the magnitudes of
the various noise components. First, the thermal noise can generally be neglected
when the amplifier gain is large enough. Furthermore, because the amplified signal
power GP s,in is much larger than the ASE noise power S ASE B o , the ASE–ASE beat
noise given by Eq. (11.29) is significantly smaller than the signal–ASE beat noise.
This also means that the second term in Eq. (11.27) is small compared to the first
term, so that
σ
2
shot ≈ 2qRGP s,in B e
(11.31)
Using these results together with the expression for S ASE from Eq. (11.24) yields
the following approximate signal-to-noise ratio (S/N) at the photodetector output:
S
N
out
=
σ
2
ph
σ
2
total
= R
2
G
2 P
2
s,in
σ
2
total
≈ R
P s,in
2q B e
G
1 + 2ηn sp (G − 1)
(11.32)
where η is the quantum efficiency of the photodetector and, from Eq. (6.11), the
mean-square input photocurrent is
i
2
ph
= σ
2
ph = R
2 G
2 P
2
s,in
(11.33)
Note that the term
S
N
in
= R
P s,in
2q B e
(11.34)
in Eq. (11.32) is the signal-to-noise ratio of an ideal photodetector at the input to the
optical amplifier. From Eq. (11.32) one then can find the noise figure of the optical
amplifier, which is a measure of the S/N degradation experienced by a signal after