

312
8 Digital Optical Fiber Links
-13 dBm
-42 dBm
29 dB
allowable
power loss
plus margin
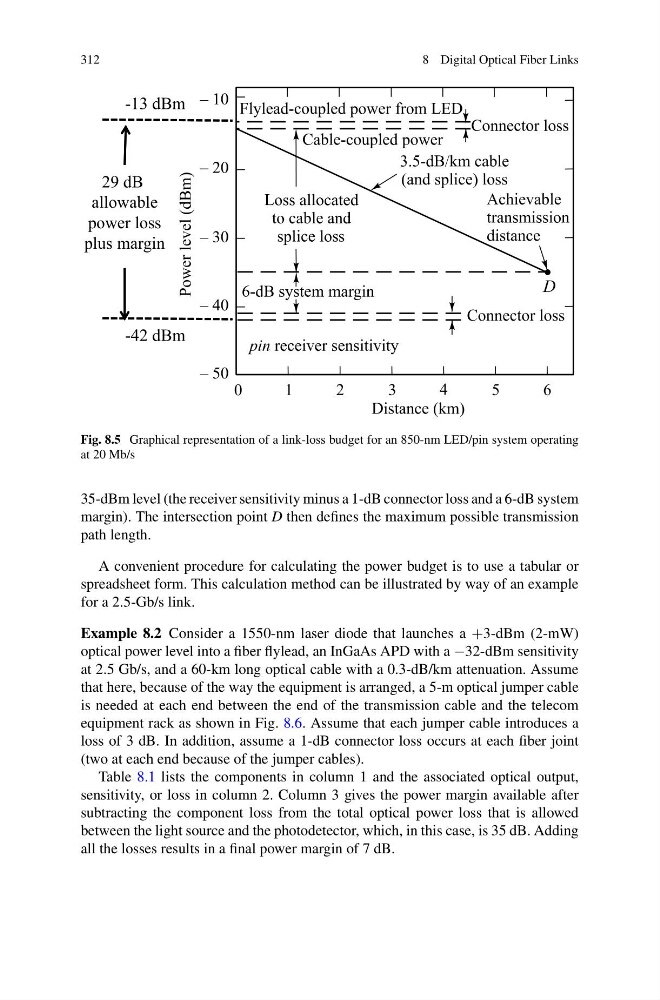
Fig. 8.5 Graphical representation of a link-loss budget for an 850-nm LED/pin system operating
at 20 Mb/s
35-dBm level (the receiver sensitivity minus a 1-dB connector loss and a 6-dB system
margin). The intersection point D then defines the maximum possible transmission
path length.
A convenient procedure for calculating the power budget is to use a tabular or
spreadsheet form. This calculation method can be illustrated by way of an example
for a 2.5-Gb/s link.
Example 8.2 Consider a 1550-nm laser diode that launches a +3-dBm (2-mW)
optical power level into a fiber flylead, an InGaAs APD with a −32-dBm sensitivity
at 2.5 Gb/s, and a 60-km long optical cable with a 0.3-dB/km attenuation. Assume
that here, because of the way the equipment is arranged, a 5-m optical jumper cable
is needed at each end between the end of the transmission cable and the telecom
equipment rack as shown in Fig. 8.6. Assume that each jumper cable introduces a
loss of 3 dB. In addition, assume a 1-dB connector loss occurs at each fiber joint
(two at each end because of the jumper cables).
Table 8.1 lists the components in column 1 and the associated optical output,
sensitivity, or loss in column 2. Column 3 gives the power margin available after
subtracting the component loss from the total optical power loss that is allowed
between the light source and the photodetector, which, in this case, is 35 dB. Adding
all the losses results in a final power margin of 7 dB.
8 Digital Optical Fiber Links
-13 dBm
-42 dBm
29 dB
allowable
power loss
plus margin
Fig. 8.5 Graphical representation of a link-loss budget for an 850-nm LED/pin system operating
at 20 Mb/s
35-dBm level (the receiver sensitivity minus a 1-dB connector loss and a 6-dB system
margin). The intersection point D then defines the maximum possible transmission
path length.
A convenient procedure for calculating the power budget is to use a tabular or
spreadsheet form. This calculation method can be illustrated by way of an example
for a 2.5-Gb/s link.
Example 8.2 Consider a 1550-nm laser diode that launches a +3-dBm (2-mW)
optical power level into a fiber flylead, an InGaAs APD with a −32-dBm sensitivity
at 2.5 Gb/s, and a 60-km long optical cable with a 0.3-dB/km attenuation. Assume
that here, because of the way the equipment is arranged, a 5-m optical jumper cable
is needed at each end between the end of the transmission cable and the telecom
equipment rack as shown in Fig. 8.6. Assume that each jumper cable introduces a
loss of 3 dB. In addition, assume a 1-dB connector loss occurs at each fiber joint
(two at each end because of the jumper cables).
Table 8.1 lists the components in column 1 and the associated optical output,
sensitivity, or loss in column 2. Column 3 gives the power margin available after
subtracting the component loss from the total optical power loss that is allowed
between the light source and the photodetector, which, in this case, is 35 dB. Adding
all the losses results in a final power margin of 7 dB.