

8.1 Basic Optical Fiber Links
311
155 Mb/s
622 Mb/s
BER = 10 -9
BER = 10 -11
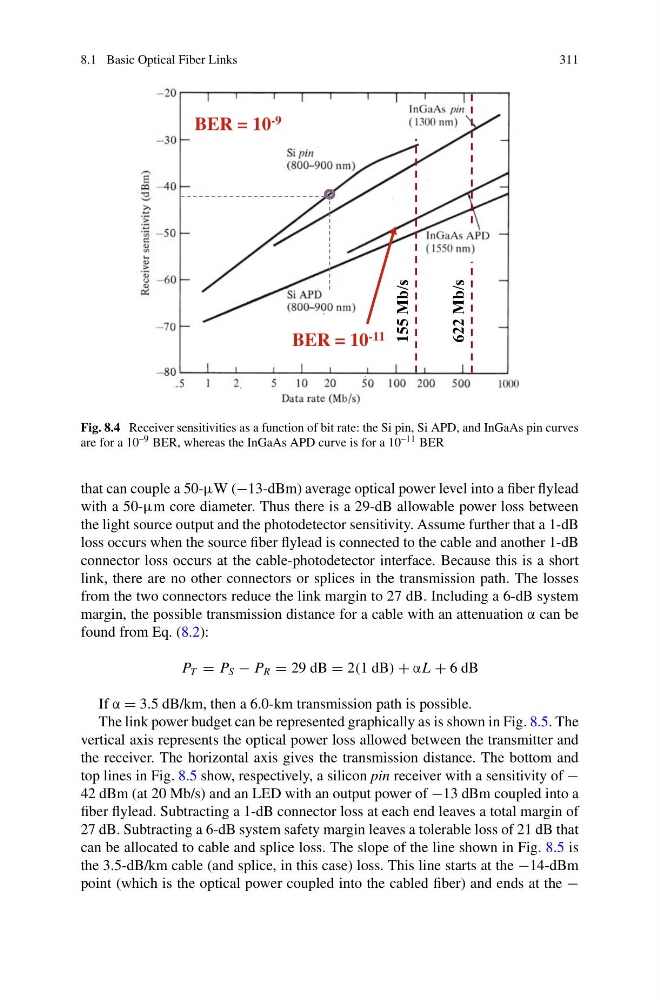
Fig. 8.4 Receiver sensitivities as a function of bit rate: the Si pin, Si APD, and InGaAs pin curves
are for a 10 –9 BER, whereas the InGaAs APD curve is for a 10 –11 BER
that can couple a 50-μW (−13-dBm) average optical power level into a fiber flylead
with a 50-μm core diameter. Thus there is a 29-dB allowable power loss between
the light source output and the photodetector sensitivity. Assume further that a 1-dB
loss occurs when the source fiber flylead is connected to the cable and another 1-dB
connector loss occurs at the cable-photodetector interface. Because this is a short
link, there are no other connectors or splices in the transmission path. The losses
from the two connectors reduce the link margin to 27 dB. Including a 6-dB system
margin, the possible transmission distance for a cable with an attenuation α can be
found from Eq. (8.2):
P T = P S − P R = 29 dB = 2(1 dB) + αL + 6 dB
If α = 3.5 dB/km, then a 6.0-km transmission path is possible.
The link power budget can be represented graphically as is shown in Fig. 8.5. The
vertical axis represents the optical power loss allowed between the transmitter and
the receiver. The horizontal axis gives the transmission distance. The bottom and
top lines in Fig. 8.5 show, respectively, a silicon pin receiver with a sensitivity of −
42 dBm (at 20 Mb/s) and an LED with an output power of −13 dBm coupled into a
fiber flylead. Subtracting a 1-dB connector loss at each end leaves a total margin of
27 dB. Subtracting a 6-dB system safety margin leaves a tolerable loss of 21 dB that
can be allocated to cable and splice loss. The slope of the line shown in Fig. 8.5 is
the 3.5-dB/km cable (and splice, in this case) loss. This line starts at the −14-dBm
point (which is the optical power coupled into the cabled fiber) and ends at the −
311
155 Mb/s
622 Mb/s
BER = 10 -9
BER = 10 -11
Fig. 8.4 Receiver sensitivities as a function of bit rate: the Si pin, Si APD, and InGaAs pin curves
are for a 10 –9 BER, whereas the InGaAs APD curve is for a 10 –11 BER
that can couple a 50-μW (−13-dBm) average optical power level into a fiber flylead
with a 50-μm core diameter. Thus there is a 29-dB allowable power loss between
the light source output and the photodetector sensitivity. Assume further that a 1-dB
loss occurs when the source fiber flylead is connected to the cable and another 1-dB
connector loss occurs at the cable-photodetector interface. Because this is a short
link, there are no other connectors or splices in the transmission path. The losses
from the two connectors reduce the link margin to 27 dB. Including a 6-dB system
margin, the possible transmission distance for a cable with an attenuation α can be
found from Eq. (8.2):
P T = P S − P R = 29 dB = 2(1 dB) + αL + 6 dB
If α = 3.5 dB/km, then a 6.0-km transmission path is possible.
The link power budget can be represented graphically as is shown in Fig. 8.5. The
vertical axis represents the optical power loss allowed between the transmitter and
the receiver. The horizontal axis gives the transmission distance. The bottom and
top lines in Fig. 8.5 show, respectively, a silicon pin receiver with a sensitivity of −
42 dBm (at 20 Mb/s) and an LED with an output power of −13 dBm coupled into a
fiber flylead. Subtracting a 1-dB connector loss at each end leaves a total margin of
27 dB. Subtracting a 6-dB system safety margin leaves a tolerable loss of 21 dB that
can be allocated to cable and splice loss. The slope of the line shown in Fig. 8.5 is
the 3.5-dB/km cable (and splice, in this case) loss. This line starts at the −14-dBm
point (which is the optical power coupled into the cabled fiber) and ends at the −