

3 Low-Carbon Transition (Peaking) of Chinese Cities: The Case …
73
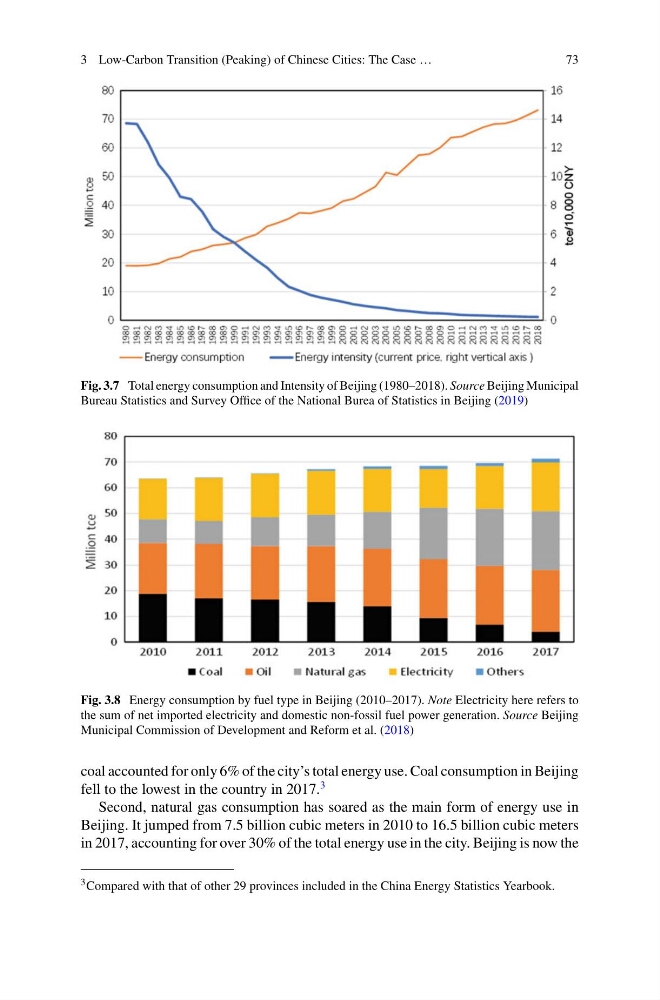
Fig. 3.7 Total energy consumption and Intensity of Beijing (1980–2018). Source Beijing Municipal
Bureau Statistics and Survey Office of the National Burea of Statistics in Beijing (2019)
Fig. 3.8 Energy consumption by fuel type in Beijing (2010–2017). Note Electricity here refers to
the sum of net imported electricity and domestic non-fossil fuel power generation. Source Beijing
Municipal Commission of Development and Reform et al. (2018)
coal accounted for only 6% of the city’s total energy use. Coal consumption in Beijing
fell to the lowest in the country in 2017.
3
Second, natural gas consumption has soared as the main form of energy use in
Beijing. It jumped from 7.5 billion cubic meters in 2010 to 16.5 billion cubic meters
in 2017, accounting for over 30% of the total energy use in the city. Beijing is now the
3 Compared with that of other 29 provinces included in the China Energy Statistics Yearbook.
73
Fig. 3.7 Total energy consumption and Intensity of Beijing (1980–2018). Source Beijing Municipal
Bureau Statistics and Survey Office of the National Burea of Statistics in Beijing (2019)
Fig. 3.8 Energy consumption by fuel type in Beijing (2010–2017). Note Electricity here refers to
the sum of net imported electricity and domestic non-fossil fuel power generation. Source Beijing
Municipal Commission of Development and Reform et al. (2018)
coal accounted for only 6% of the city’s total energy use. Coal consumption in Beijing
fell to the lowest in the country in 2017.
3
Second, natural gas consumption has soared as the main form of energy use in
Beijing. It jumped from 7.5 billion cubic meters in 2010 to 16.5 billion cubic meters
in 2017, accounting for over 30% of the total energy use in the city. Beijing is now the
3 Compared with that of other 29 provinces included in the China Energy Statistics Yearbook.