

2 Research on Urbanization and Low-Carbon Development in China
39
0.00
500.00
1000.00
1500.00
2000.00
2500.00
3000.00
3500.00
tons of carbon dioxide per square kilometer
Finance
Germany
UK
Yangtze River Delta region Pearl River Delta region
Bohai Rim
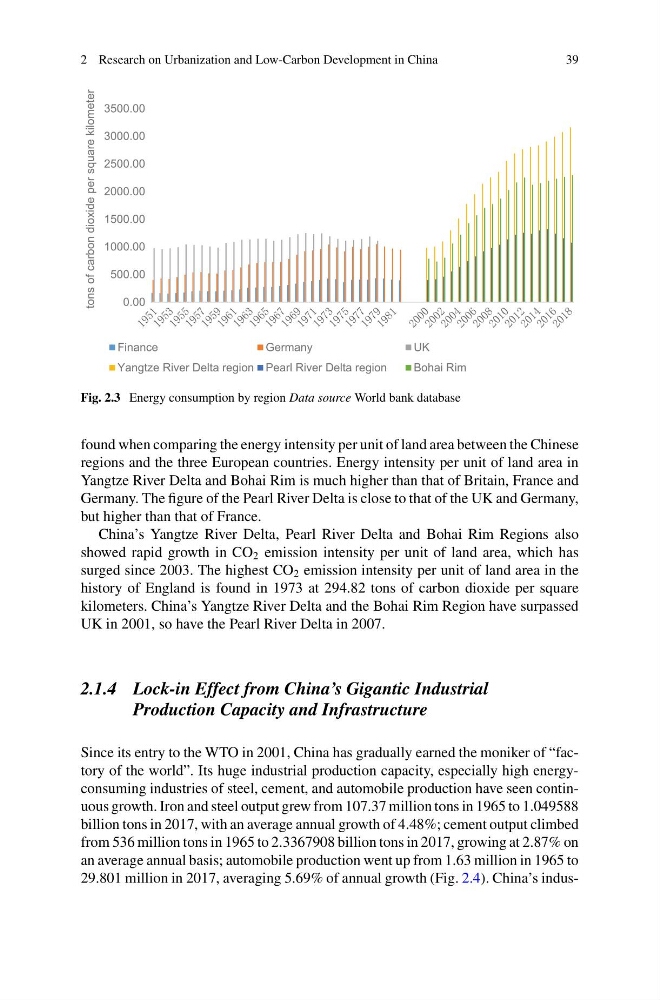
Fig. 2.3 Energy consumption by region Data source World bank database
found when comparing the energy intensity per unit of land area between the Chinese
regions and the three European countries. Energy intensity per unit of land area in
Yangtze River Delta and Bohai Rim is much higher than that of Britain, France and
Germany. The figure of the Pearl River Delta is close to that of the UK and Germany,
but higher than that of France.
China’s Yangtze River Delta, Pearl River Delta and Bohai Rim Regions also
showed rapid growth in CO 2 emission intensity per unit of land area, which has
surged since 2003. The highest CO 2 emission intensity per unit of land area in the
history of England is found in 1973 at 294.82 tons of carbon dioxide per square
kilometers. China’s Yangtze River Delta and the Bohai Rim Region have surpassed
UK in 2001, so have the Pearl River Delta in 2007.
2.1.4 Lock-in Effect from China’s Gigantic Industrial
Production Capacity and Infrastructure
Since its entry to the WTO in 2001, China has gradually earned the moniker of “factory of the world”. Its huge industrial production capacity, especially high energyconsuming industries of steel, cement, and automobile production have seen continuous growth. Iron and steel output grew from 107.37 million tons in 1965 to 1.049588
billion tons in 2017, with an average annual growth of 4.48%; cement output climbed
from 536 million tons in 1965 to 2.3367908 billion tons in 2017, growing at 2.87% on
an average annual basis; automobile production went up from 1.63 million in 1965 to
29.801 million in 2017, averaging 5.69% of annual growth (Fig. 2.4). China’s indus-
39
0.00
500.00
1000.00
1500.00
2000.00
2500.00
3000.00
3500.00
tons of carbon dioxide per square kilometer
Finance
Germany
UK
Yangtze River Delta region Pearl River Delta region
Bohai Rim
Fig. 2.3 Energy consumption by region Data source World bank database
found when comparing the energy intensity per unit of land area between the Chinese
regions and the three European countries. Energy intensity per unit of land area in
Yangtze River Delta and Bohai Rim is much higher than that of Britain, France and
Germany. The figure of the Pearl River Delta is close to that of the UK and Germany,
but higher than that of France.
China’s Yangtze River Delta, Pearl River Delta and Bohai Rim Regions also
showed rapid growth in CO 2 emission intensity per unit of land area, which has
surged since 2003. The highest CO 2 emission intensity per unit of land area in the
history of England is found in 1973 at 294.82 tons of carbon dioxide per square
kilometers. China’s Yangtze River Delta and the Bohai Rim Region have surpassed
UK in 2001, so have the Pearl River Delta in 2007.
2.1.4 Lock-in Effect from China’s Gigantic Industrial
Production Capacity and Infrastructure
Since its entry to the WTO in 2001, China has gradually earned the moniker of “factory of the world”. Its huge industrial production capacity, especially high energyconsuming industries of steel, cement, and automobile production have seen continuous growth. Iron and steel output grew from 107.37 million tons in 1965 to 1.049588
billion tons in 2017, with an average annual growth of 4.48%; cement output climbed
from 536 million tons in 1965 to 2.3367908 billion tons in 2017, growing at 2.87% on
an average annual basis; automobile production went up from 1.63 million in 1965 to
29.801 million in 2017, averaging 5.69% of annual growth (Fig. 2.4). China’s indus-