

4 Phthalocyanine and Related Analogues
99
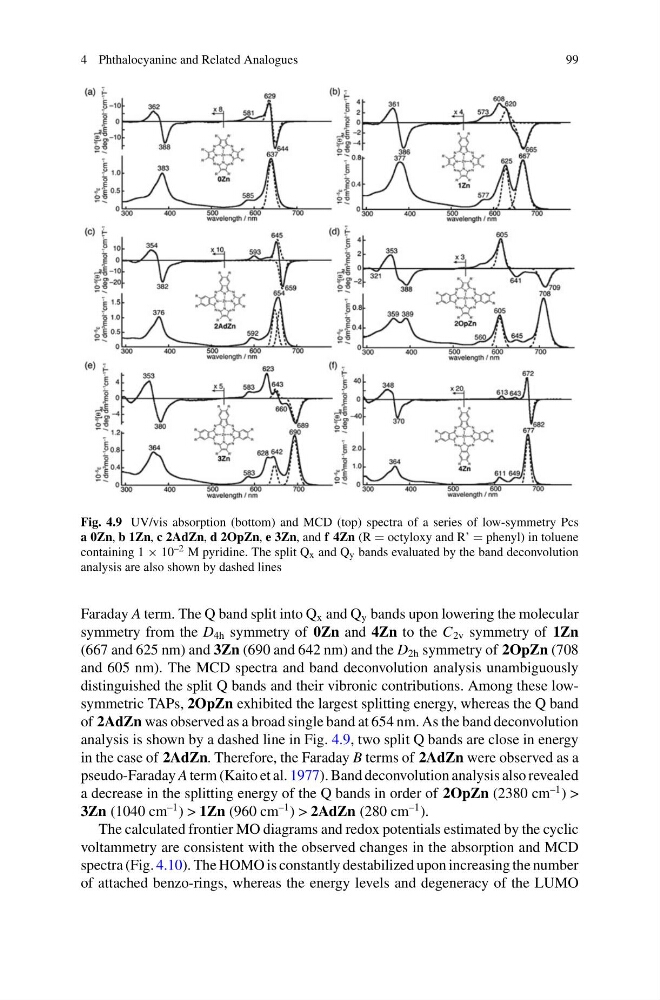
Fig. 4.9 UV/vis absorption (bottom) and MCD (top) spectra of a series of low-symmetry Pcs
a 0Zn, b 1Zn, c 2AdZn, d 2OpZn, e 3Zn, and f 4Zn (R = octyloxy and R’ = phenyl) in toluene
containing 1 × 10 –2 M pyridine. The split Q x and Q y bands evaluated by the band deconvolution
analysis are also shown by dashed lines
Faraday A term. The Q band split into Q x and Q y bands upon lowering the molecular
symmetry from the D 4h symmetry of 0Zn and 4Zn to the C 2v symmetry of 1Zn
(667 and 625 nm) and 3Zn (690 and 642 nm) and the D 2h symmetry of 2OpZn (708
and 605 nm). The MCD spectra and band deconvolution analysis unambiguously
distinguished the split Q bands and their vibronic contributions. Among these lowsymmetric TAPs, 2OpZn exhibited the largest splitting energy, whereas the Q band
of 2AdZn was observed as a broad single band at 654 nm. As the band deconvolution
analysis is shown by a dashed line in Fig. 4.9, two split Q bands are close in energy
in the case of 2AdZn. Therefore, the Faraday B terms of 2AdZn were observed as a
pseudo-Faraday A term (Kaito et al. 1977). Band deconvolution analysis also revealed
a decrease in the splitting energy of the Q bands in order of 2OpZn (2380 cm
–1 ) >
3Zn (1040 cm
–1 ) > 1Zn (960 cm
–1 ) > 2AdZn (280 cm
–1 ).
The calculated frontier MO diagrams and redox potentials estimated by the cyclic
voltammetry are consistent with the observed changes in the absorption and MCD
spectra (Fig. 4.10). The HOMO is constantly destabilized upon increasing the number
of attached benzo-rings, whereas the energy levels and degeneracy of the LUMO
99
Fig. 4.9 UV/vis absorption (bottom) and MCD (top) spectra of a series of low-symmetry Pcs
a 0Zn, b 1Zn, c 2AdZn, d 2OpZn, e 3Zn, and f 4Zn (R = octyloxy and R’ = phenyl) in toluene
containing 1 × 10 –2 M pyridine. The split Q x and Q y bands evaluated by the band deconvolution
analysis are also shown by dashed lines
Faraday A term. The Q band split into Q x and Q y bands upon lowering the molecular
symmetry from the D 4h symmetry of 0Zn and 4Zn to the C 2v symmetry of 1Zn
(667 and 625 nm) and 3Zn (690 and 642 nm) and the D 2h symmetry of 2OpZn (708
and 605 nm). The MCD spectra and band deconvolution analysis unambiguously
distinguished the split Q bands and their vibronic contributions. Among these lowsymmetric TAPs, 2OpZn exhibited the largest splitting energy, whereas the Q band
of 2AdZn was observed as a broad single band at 654 nm. As the band deconvolution
analysis is shown by a dashed line in Fig. 4.9, two split Q bands are close in energy
in the case of 2AdZn. Therefore, the Faraday B terms of 2AdZn were observed as a
pseudo-Faraday A term (Kaito et al. 1977). Band deconvolution analysis also revealed
a decrease in the splitting energy of the Q bands in order of 2OpZn (2380 cm
–1 ) >
3Zn (1040 cm
–1 ) > 1Zn (960 cm
–1 ) > 2AdZn (280 cm
–1 ).
The calculated frontier MO diagrams and redox potentials estimated by the cyclic
voltammetry are consistent with the observed changes in the absorption and MCD
spectra (Fig. 4.10). The HOMO is constantly destabilized upon increasing the number
of attached benzo-rings, whereas the energy levels and degeneracy of the LUMO