

4 Phthalocyanine and Related Analogues
95
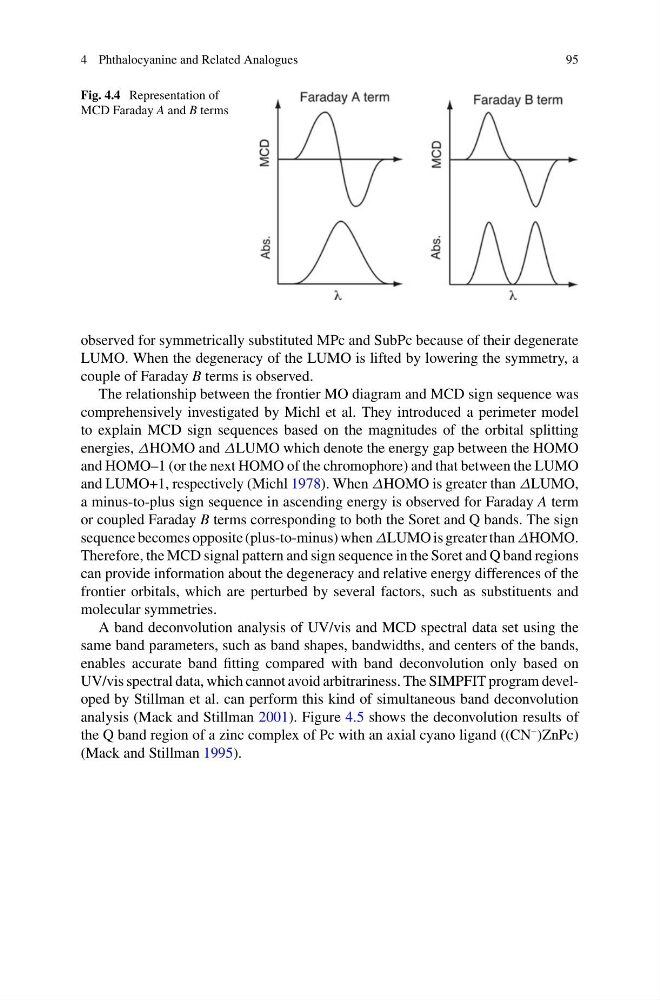
Fig. 4.4 Representation of
MCD Faraday A and B terms
observed for symmetrically substituted MPc and SubPc because of their degenerate
LUMO. When the degeneracy of the LUMO is lifted by lowering the symmetry, a
couple of Faraday B terms is observed.
The relationship between the frontier MO diagram and MCD sign sequence was
comprehensively investigated by Michl et al. They introduced a perimeter model
to explain MCD sign sequences based on the magnitudes of the orbital splitting
energies, ΔHOMO and ΔLUMO which denote the energy gap between the HOMO
and HOMO–1 (or the next HOMO of the chromophore) and that between the LUMO
and LUMO+1, respectively (Michl 1978). When ΔHOMO is greater than ΔLUMO,
a minus-to-plus sign sequence in ascending energy is observed for Faraday A term
or coupled Faraday B terms corresponding to both the Soret and Q bands. The sign
sequence becomes opposite (plus-to-minus) when ΔLUMO is greater than ΔHOMO.
Therefore, the MCD signal pattern and sign sequence in the Soret and Q band regions
can provide information about the degeneracy and relative energy differences of the
frontier orbitals, which are perturbed by several factors, such as substituents and
molecular symmetries.
A band deconvolution analysis of UV/vis and MCD spectral data set using the
same band parameters, such as band shapes, bandwidths, and centers of the bands,
enables accurate band fitting compared with band deconvolution only based on
UV/vis spectral data, which cannot avoid arbitrariness. The SIMPFIT program developed by Stillman et al. can perform this kind of simultaneous band deconvolution
analysis (Mack and Stillman 2001). Figure 4.5 shows the deconvolution results of
the Q band region of a zinc complex of Pc with an axial cyano ligand ((CN
– )ZnPc)
(Mack and Stillman 1995).
95
Fig. 4.4 Representation of
MCD Faraday A and B terms
observed for symmetrically substituted MPc and SubPc because of their degenerate
LUMO. When the degeneracy of the LUMO is lifted by lowering the symmetry, a
couple of Faraday B terms is observed.
The relationship between the frontier MO diagram and MCD sign sequence was
comprehensively investigated by Michl et al. They introduced a perimeter model
to explain MCD sign sequences based on the magnitudes of the orbital splitting
energies, ΔHOMO and ΔLUMO which denote the energy gap between the HOMO
and HOMO–1 (or the next HOMO of the chromophore) and that between the LUMO
and LUMO+1, respectively (Michl 1978). When ΔHOMO is greater than ΔLUMO,
a minus-to-plus sign sequence in ascending energy is observed for Faraday A term
or coupled Faraday B terms corresponding to both the Soret and Q bands. The sign
sequence becomes opposite (plus-to-minus) when ΔLUMO is greater than ΔHOMO.
Therefore, the MCD signal pattern and sign sequence in the Soret and Q band regions
can provide information about the degeneracy and relative energy differences of the
frontier orbitals, which are perturbed by several factors, such as substituents and
molecular symmetries.
A band deconvolution analysis of UV/vis and MCD spectral data set using the
same band parameters, such as band shapes, bandwidths, and centers of the bands,
enables accurate band fitting compared with band deconvolution only based on
UV/vis spectral data, which cannot avoid arbitrariness. The SIMPFIT program developed by Stillman et al. can perform this kind of simultaneous band deconvolution
analysis (Mack and Stillman 2001). Figure 4.5 shows the deconvolution results of
the Q band region of a zinc complex of Pc with an axial cyano ligand ((CN
– )ZnPc)
(Mack and Stillman 1995).