

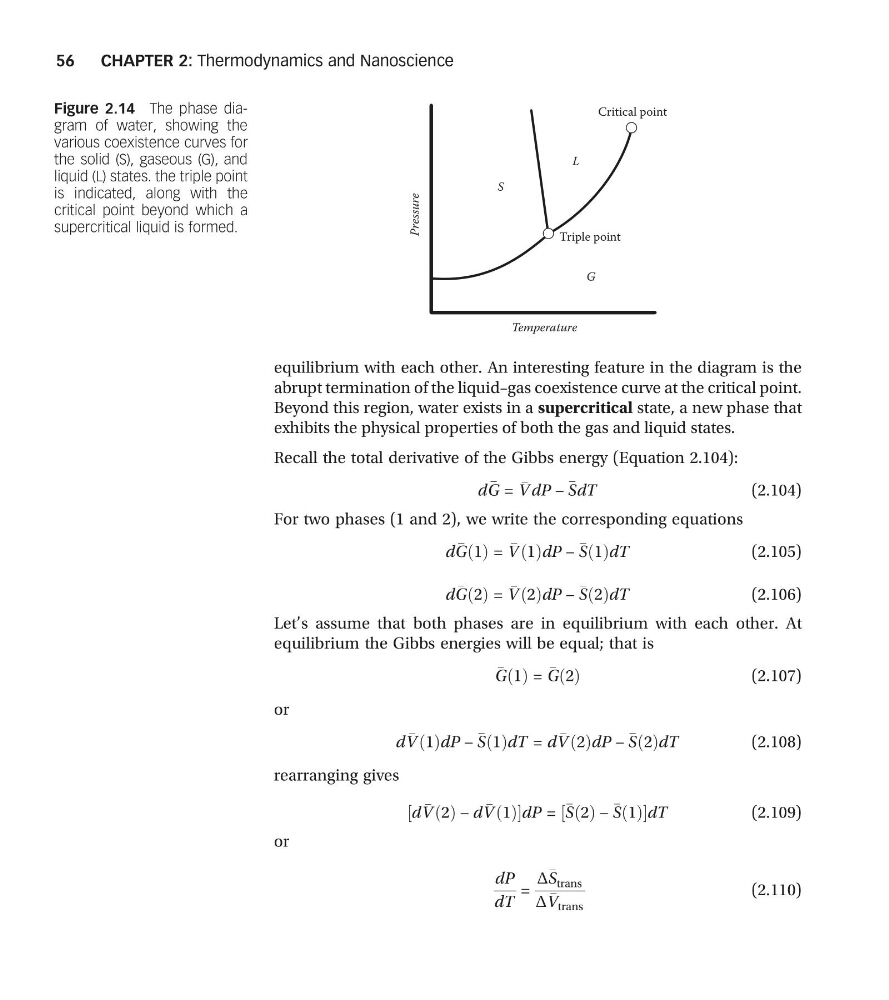
equilibrium with each other. An interesting feature in the diagram is the
abrupt termination of the liquid–gas coexistence curve at the critical point.
Beyond this region, water exists in a supercritical state, a new phase that
exhibits the physical properties of both the gas and liquid states.
Recall the total derivative of the Gibbs energy (Equation 2.104):
d
G =
V dP −
SdT
(2.104)
For two phases (1 and 2), we write the corresponding equations
d
G 1
ð Þ =
V 1
ð ÞdP −
S 1
ð ÞdT
(2.105)
d
G 2
ð Þ =
V 2
ð ÞdP −
S 2
ð ÞdT
(2.106)
Let’s assume that both phases are in equilibrium with each other. At
equilibrium the Gibbs energies will be equal; that is
G 1
ð Þ =
G 2
ð Þ
(2.107)
or
d
V 1
ð ÞdP −
S 1
ð ÞdT = d
V 2
ð ÞdP −
S 2
ð ÞdT
(2.108)
rearranging gives
d
V 2
ð Þ − d
V 1
ð Þ
½
dP =
S 2
ð Þ −
S 1
ð Þ
½
dT
(2.109)
or
dP
dT
=
Δ
S trans
Δ
V trans
(2.110)
Triple point
Critical point
Temperature
Pressure
S
L
G
Figure 2.14 The phase diagram of water, showing the
various coexistence curves for
the solid (S), gaseous (G), and
liquid (L) states. the triple point
is indicated, along with the
critical point beyond which a
supercritical liquid is formed.
CHAPTER 2: Thermodynamics and Nanoscience
56
abrupt termination of the liquid–gas coexistence curve at the critical point.
Beyond this region, water exists in a supercritical state, a new phase that
exhibits the physical properties of both the gas and liquid states.
Recall the total derivative of the Gibbs energy (Equation 2.104):
d
G =
V dP −
SdT
(2.104)
For two phases (1 and 2), we write the corresponding equations
d
G 1
ð Þ =
V 1
ð ÞdP −
S 1
ð ÞdT
(2.105)
d
G 2
ð Þ =
V 2
ð ÞdP −
S 2
ð ÞdT
(2.106)
Let’s assume that both phases are in equilibrium with each other. At
equilibrium the Gibbs energies will be equal; that is
G 1
ð Þ =
G 2
ð Þ
(2.107)
or
d
V 1
ð ÞdP −
S 1
ð ÞdT = d
V 2
ð ÞdP −
S 2
ð ÞdT
(2.108)
rearranging gives
d
V 2
ð Þ − d
V 1
ð Þ
½
dP =
S 2
ð Þ −
S 1
ð Þ
½
dT
(2.109)
or
dP
dT
=
Δ
S trans
Δ
V trans
(2.110)
Triple point
Critical point
Temperature
Pressure
S
L
G
Figure 2.14 The phase diagram of water, showing the
various coexistence curves for
the solid (S), gaseous (G), and
liquid (L) states. the triple point
is indicated, along with the
critical point beyond which a
supercritical liquid is formed.
CHAPTER 2: Thermodynamics and Nanoscience
56