

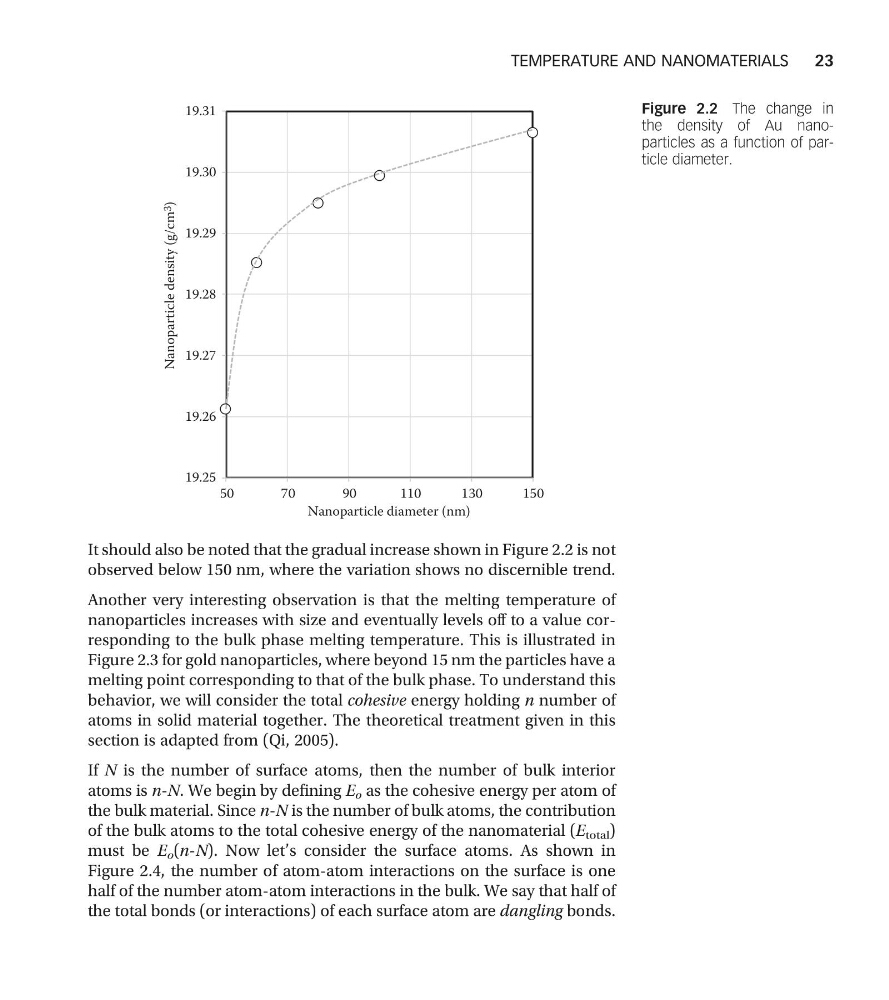
It should also be noted that the gradual increase shown in Figure 2.2 is not
observed below 150 nm, where the variation shows no discernible trend.
Another very interesting observation is that the melting temperature of
nanoparticles increases with size and eventually levels off to a value corresponding to the bulk phase melting temperature. This is illustrated in
Figure 2.3 for gold nanoparticles, where beyond 15 nm the particles have a
melting point corresponding to that of the bulk phase. To understand this
behavior, we will consider the total cohesive energy holding n number of
atoms in solid material together. The theoretical treatment given in this
section is adapted from (Qi, 2005).
If N is the number of surface atoms, then the number of bulk interior
atoms is n-N. We begin by defining E o as the cohesive energy per atom of
the bulk material. Since n-N is the number of bulk atoms, the contribution
of the bulk atoms to the total cohesive energy of the nanomaterial (E total )
must be E o (n-N). Now let’s consider the surface atoms. As shown in
Figure 2.4, the number of atom-atom interactions on the surface is one
half of the number atom-atom interactions in the bulk. We say that half of
the total bonds (or interactions) of each surface atom are dangling bonds.
Nanoparticle diameter (nm)
Nanoparticle density (g/cm 3
)
19.25
19.26
19.27
19.28
19.29
19.30
19.31
50
70
90
110
130
150
Figure 2.2 The change in
the density of Au nanoparticles as a function of particle diameter.
TEMPERATURE AND NANOMATERIALS
23
observed below 150 nm, where the variation shows no discernible trend.
Another very interesting observation is that the melting temperature of
nanoparticles increases with size and eventually levels off to a value corresponding to the bulk phase melting temperature. This is illustrated in
Figure 2.3 for gold nanoparticles, where beyond 15 nm the particles have a
melting point corresponding to that of the bulk phase. To understand this
behavior, we will consider the total cohesive energy holding n number of
atoms in solid material together. The theoretical treatment given in this
section is adapted from (Qi, 2005).
If N is the number of surface atoms, then the number of bulk interior
atoms is n-N. We begin by defining E o as the cohesive energy per atom of
the bulk material. Since n-N is the number of bulk atoms, the contribution
of the bulk atoms to the total cohesive energy of the nanomaterial (E total )
must be E o (n-N). Now let’s consider the surface atoms. As shown in
Figure 2.4, the number of atom-atom interactions on the surface is one
half of the number atom-atom interactions in the bulk. We say that half of
the total bonds (or interactions) of each surface atom are dangling bonds.
Nanoparticle diameter (nm)
Nanoparticle density (g/cm 3
)
19.25
19.26
19.27
19.28
19.29
19.30
19.31
50
70
90
110
130
150
Figure 2.2 The change in
the density of Au nanoparticles as a function of particle diameter.
TEMPERATURE AND NANOMATERIALS
23