

which shows how the fluorescence intensity f (t) recovers (increases) over
time, t:
f t
ð Þ = e
−2t D =t I 0
2t D
t
+ I 1
2t D
t
!
(10.2)
where I 0 and I 1 are known as modified Bessel functions, and t D = r
2 /4D
where r is the radius of the bleached area at t = 0 and D is the fission
coefficient. The diffusion constant D can be simply calculated from a fit of
this equation. Diffusion constant values for lipids tend to be in the range
of 0.5–5 μm
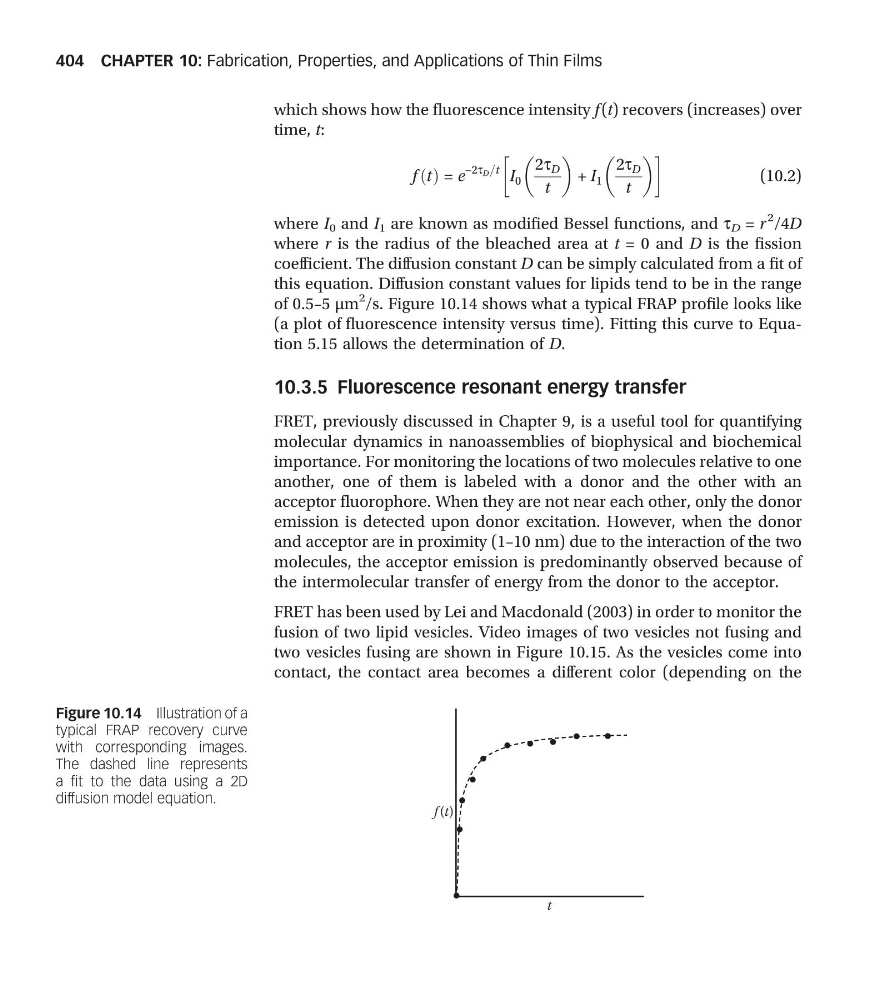
2 /s. Figure 10.14 shows what a typical FRAP profile looks like
(a plot of fluorescence intensity versus time). Fitting this curve to Equation 5.15 allows the determination of D.
10.3.5 Fluorescence resonant energy transfer
FRET, previously discussed in Chapter 9, is a useful tool for quantifying
molecular dynamics in nanoassemblies of biophysical and biochemical
importance. For monitoring the locations of two molecules relative to one
another, one of them is labeled with a donor and the other with an
acceptor fluorophore. When they are not near each other, only the donor
emission is detected upon donor excitation. However, when the donor
and acceptor are in proximity (1–10 nm) due to the interaction of the two
molecules, the acceptor emission is predominantly observed because of
the intermolecular transfer of energy from the donor to the acceptor.
FRET has been used by Lei and Macdonald (2003) in order to monitor the
fusion of two lipid vesicles. Video images of two vesicles not fusing and
two vesicles fusing are shown in Figure 10.15. As the vesicles come into
contact, the contact area becomes a different color (depending on the
f (t)
t
Figure 10.14 Illustration of a
typical FRAP recovery curve
with corresponding images.
The dashed line represents
a fit to the data using a 2D
diffusion model equation.
CHAPTER 10: Fabrication, Properties, and Applications of Thin Films
404
time, t:
f t
ð Þ = e
−2t D =t I 0
2t D
t
+ I 1
2t D
t
!
(10.2)
where I 0 and I 1 are known as modified Bessel functions, and t D = r
2 /4D
where r is the radius of the bleached area at t = 0 and D is the fission
coefficient. The diffusion constant D can be simply calculated from a fit of
this equation. Diffusion constant values for lipids tend to be in the range
of 0.5–5 μm
2 /s. Figure 10.14 shows what a typical FRAP profile looks like
(a plot of fluorescence intensity versus time). Fitting this curve to Equation 5.15 allows the determination of D.
10.3.5 Fluorescence resonant energy transfer
FRET, previously discussed in Chapter 9, is a useful tool for quantifying
molecular dynamics in nanoassemblies of biophysical and biochemical
importance. For monitoring the locations of two molecules relative to one
another, one of them is labeled with a donor and the other with an
acceptor fluorophore. When they are not near each other, only the donor
emission is detected upon donor excitation. However, when the donor
and acceptor are in proximity (1–10 nm) due to the interaction of the two
molecules, the acceptor emission is predominantly observed because of
the intermolecular transfer of energy from the donor to the acceptor.
FRET has been used by Lei and Macdonald (2003) in order to monitor the
fusion of two lipid vesicles. Video images of two vesicles not fusing and
two vesicles fusing are shown in Figure 10.15. As the vesicles come into
contact, the contact area becomes a different color (depending on the
f (t)
t
Figure 10.14 Illustration of a
typical FRAP recovery curve
with corresponding images.
The dashed line represents
a fit to the data using a 2D
diffusion model equation.
CHAPTER 10: Fabrication, Properties, and Applications of Thin Films
404