

where C is the surfactant concentration in solution below the CMC and R
is the molar gas constant in J K
−1 mol
−1 . The surface excess is obtained
from the slope of a plot of the surface tension versus the logarithm of the
concentration. For ionic amphiphiles, a slightly different equation is used
(Equation 7.20) because the presence of the counterion has to be taken
into account and the surface-surfactant-counterion system as a whole
must be electrically neutral.
G = −
1
2RT
dg
d ln C
(7.20)
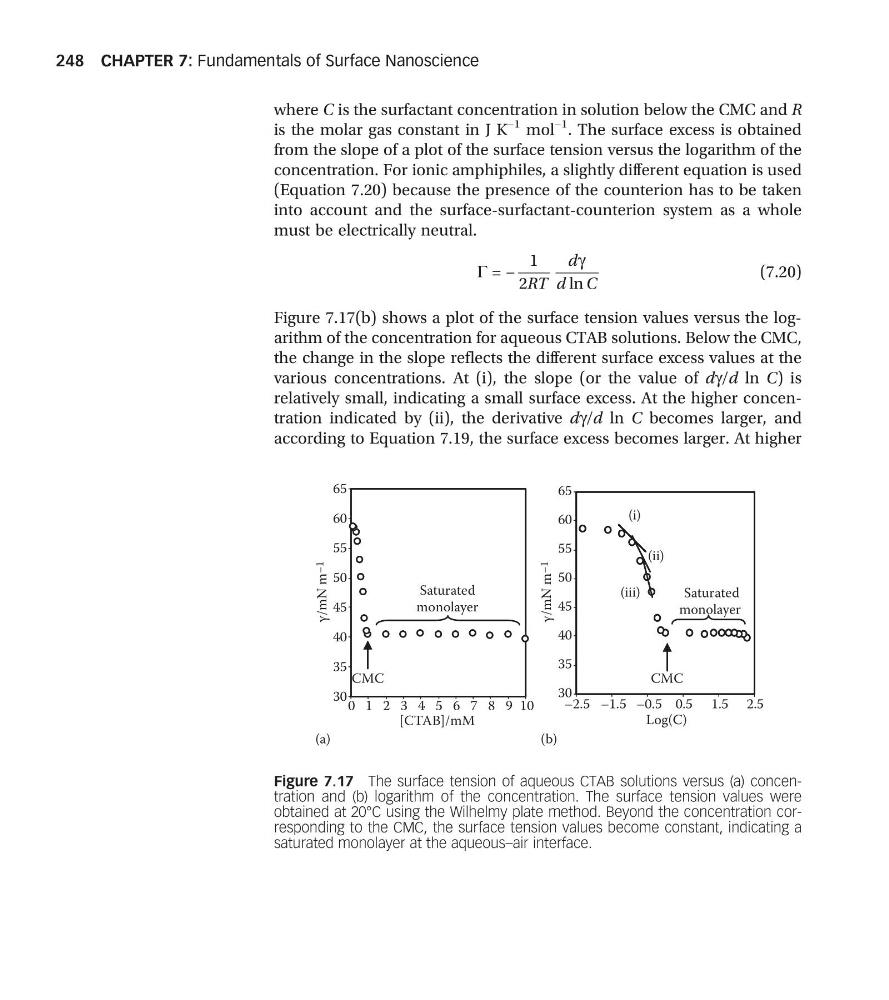
Figure 7.17(b) shows a plot of the surface tension values versus the logarithm of the concentration for aqueous CTAB solutions. Below the CMC,
the change in the slope reflects the different surface excess values at the
various concentrations. At (i), the slope (or the value of dg/d ln C) is
relatively small, indicating a small surface excess. At the higher concentration indicated by (ii), the derivative dg/d ln C becomes larger, and
according to Equation 7.19, the surface excess becomes larger. At higher
60
65
(a)
60
65
(b)
(i)
45
50
55
Saturated
monolayer
45
50
55
Saturated
monolayer
(ii)
(iii)
γ/mN m –1
γ/mN m –1
30
35
40
CMC
30
35
40
–2.5
CMC
[CTAB]/mM
Log(C)
10
9
8
7
6
5
4
3
2
1
0
2.5
1.5
0.5
–0.5
–1.5
Figure 7.17 The surface tension of aqueous CTAB solutions versus (a) concentration and (b) logarithm of the concentration. The surface tension values were
obtained at 20°C using the Wilhelmy plate method. Beyond the concentration corresponding to the CMC, the surface tension values become constant, indicating a
saturated monolayer at the aqueous–air interface.
CHAPTER 7: Fundamentals of Surface Nanoscience
248
is the molar gas constant in J K
−1 mol
−1 . The surface excess is obtained
from the slope of a plot of the surface tension versus the logarithm of the
concentration. For ionic amphiphiles, a slightly different equation is used
(Equation 7.20) because the presence of the counterion has to be taken
into account and the surface-surfactant-counterion system as a whole
must be electrically neutral.
G = −
1
2RT
dg
d ln C
(7.20)
Figure 7.17(b) shows a plot of the surface tension values versus the logarithm of the concentration for aqueous CTAB solutions. Below the CMC,
the change in the slope reflects the different surface excess values at the
various concentrations. At (i), the slope (or the value of dg/d ln C) is
relatively small, indicating a small surface excess. At the higher concentration indicated by (ii), the derivative dg/d ln C becomes larger, and
according to Equation 7.19, the surface excess becomes larger. At higher
60
65
(a)
60
65
(b)
(i)
45
50
55
Saturated
monolayer
45
50
55
Saturated
monolayer
(ii)
(iii)
γ/mN m –1
γ/mN m –1
30
35
40
CMC
30
35
40
–2.5
CMC
[CTAB]/mM
Log(C)
10
9
8
7
6
5
4
3
2
1
0
2.5
1.5
0.5
–0.5
–1.5
Figure 7.17 The surface tension of aqueous CTAB solutions versus (a) concentration and (b) logarithm of the concentration. The surface tension values were
obtained at 20°C using the Wilhelmy plate method. Beyond the concentration corresponding to the CMC, the surface tension values become constant, indicating a
saturated monolayer at the aqueous–air interface.
CHAPTER 7: Fundamentals of Surface Nanoscience
248