

In this equation n a and n std are the refractive indexes of the solvents in
which the material and the standard were dissolved, respectively. g x is
effectively defined as the derivative of the total fluorescence intensity of a
fluorophore with respect to its absorbance of the excitation light (i.e., a
measure of how the total fluorescence intensity changes with respect to
absorbance). For low concentrations of the fluorophore, the relationship
is usually linear (i.e., g x is constant), so g x can be calculated by integrating
the total fluorescence spectrum for a certain excitation wavelength and
then plotting integrated fluorescence intensity versus absorbance of the
excitation wavelength for a number of different concentrations.
6.1.4.2 Setup of a fluorometer for bulk phase and thin-film fluorescence
measurements
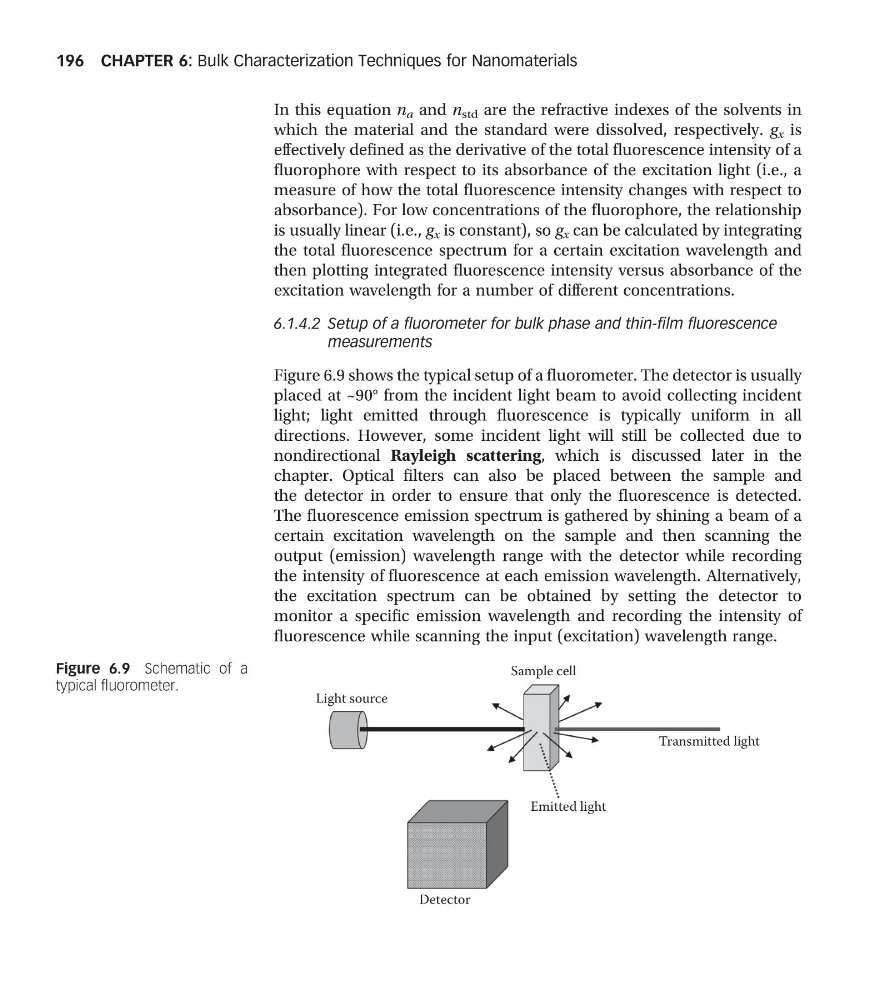
Figure 6.9 shows the typical setup of a fluorometer. The detector is usually
placed at ~90° from the incident light beam to avoid collecting incident
light; light emitted through fluorescence is typically uniform in all
directions. However, some incident light will still be collected due to
nondirectional Rayleigh scattering, which is discussed later in the
chapter. Optical filters can also be placed between the sample and
the detector in order to ensure that only the fluorescence is detected.
The fluorescence emission spectrum is gathered by shining a beam of a
certain excitation wavelength on the sample and then scanning the
output (emission) wavelength range with the detector while recording
the intensity of fluorescence at each emission wavelength. Alternatively,
the excitation spectrum can be obtained by setting the detector to
monitor a specific emission wavelength and recording the intensity of
fluorescence while scanning the input (excitation) wavelength range.
Detector
Light source
Sample cell
Transmitted light
Emitted light
Figure 6.9 Schematic of a
typical fluorometer.
CHAPTER 6: Bulk Characterization Techniques for Nanomaterials
196
which the material and the standard were dissolved, respectively. g x is
effectively defined as the derivative of the total fluorescence intensity of a
fluorophore with respect to its absorbance of the excitation light (i.e., a
measure of how the total fluorescence intensity changes with respect to
absorbance). For low concentrations of the fluorophore, the relationship
is usually linear (i.e., g x is constant), so g x can be calculated by integrating
the total fluorescence spectrum for a certain excitation wavelength and
then plotting integrated fluorescence intensity versus absorbance of the
excitation wavelength for a number of different concentrations.
6.1.4.2 Setup of a fluorometer for bulk phase and thin-film fluorescence
measurements
Figure 6.9 shows the typical setup of a fluorometer. The detector is usually
placed at ~90° from the incident light beam to avoid collecting incident
light; light emitted through fluorescence is typically uniform in all
directions. However, some incident light will still be collected due to
nondirectional Rayleigh scattering, which is discussed later in the
chapter. Optical filters can also be placed between the sample and
the detector in order to ensure that only the fluorescence is detected.
The fluorescence emission spectrum is gathered by shining a beam of a
certain excitation wavelength on the sample and then scanning the
output (emission) wavelength range with the detector while recording
the intensity of fluorescence at each emission wavelength. Alternatively,
the excitation spectrum can be obtained by setting the detector to
monitor a specific emission wavelength and recording the intensity of
fluorescence while scanning the input (excitation) wavelength range.
Detector
Light source
Sample cell
Transmitted light
Emitted light
Figure 6.9 Schematic of a
typical fluorometer.
CHAPTER 6: Bulk Characterization Techniques for Nanomaterials
196