

U r, q
ð Þ =
q ion μ cos q
4πe 0 r
2
12
(5.5)
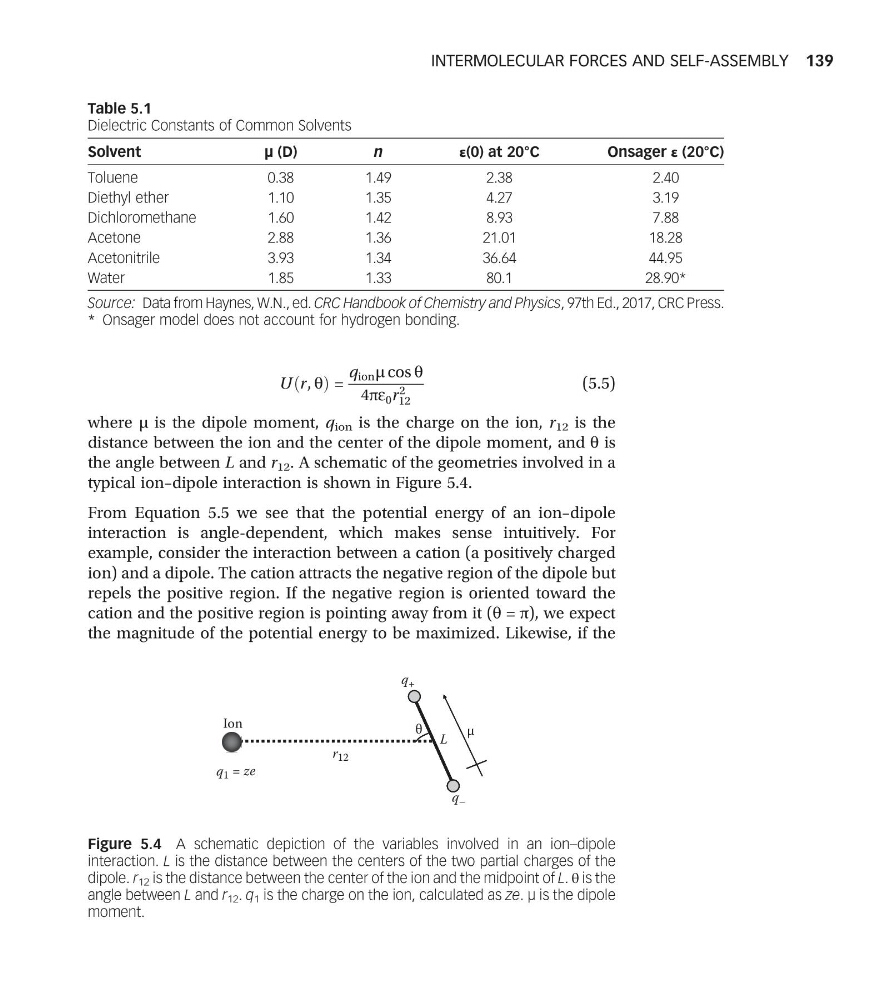
where µ is the dipole moment, q ion is the charge on the ion, r 12 is the
distance between the ion and the center of the dipole moment, and q is
the angle between L and r 12 . A schematic of the geometries involved in a
typical ion–dipole interaction is shown in Figure 5.4.
From Equation 5.5 we see that the potential energy of an ion–dipole
interaction is angle-dependent, which makes sense intuitively. For
example, consider the interaction between a cation (a positively charged
ion) and a dipole. The cation attracts the negative region of the dipole but
repels the positive region. If the negative region is oriented toward the
cation and the positive region is pointing away from it (q = π), we expect
the magnitude of the potential energy to be maximized. Likewise, if the
Table 5.1
Dielectric Constants of Common Solvents
Solvent
μ (D)
n
ε(0) at 20°C
Onsager ε (20°C)
Toluene
0.38
1.49
2.38
2.40
Diethyl ether
1.10
1.35
4.27
3.19
Dichloromethane
1.60
1.42
8.93
7.88
Acetone
2.88
1.36
21.01
18.28
Acetonitrile
3.93
1.34
36.64
44.95
Water
1.85
1.33
80.1
28.90*
Source: Data from Haynes, W.N., ed. CRC Handbook of Chemistry and Physics, 97th Ed., 2017, CRC Press.
* Onsager model does not account for hydrogen bonding.
Ion
q +
q –
q 1 = ze
L
r 12
μ
θ
Figure 5.4 A schematic depiction of the variables involved in an ion–dipole
interaction. L is the distance between the centers of the two partial charges of the
dipole. r 12 is the distance between the center of the ion and the midpoint of L. θ is the
angle between L and r 12 . q 1 is the charge on the ion, calculated as ze. µ is the dipole
moment.
INTERMOLECULAR FORCES AND SELF-ASSEMBLY 139
ð Þ =
q ion μ cos q
4πe 0 r
2
12
(5.5)
where µ is the dipole moment, q ion is the charge on the ion, r 12 is the
distance between the ion and the center of the dipole moment, and q is
the angle between L and r 12 . A schematic of the geometries involved in a
typical ion–dipole interaction is shown in Figure 5.4.
From Equation 5.5 we see that the potential energy of an ion–dipole
interaction is angle-dependent, which makes sense intuitively. For
example, consider the interaction between a cation (a positively charged
ion) and a dipole. The cation attracts the negative region of the dipole but
repels the positive region. If the negative region is oriented toward the
cation and the positive region is pointing away from it (q = π), we expect
the magnitude of the potential energy to be maximized. Likewise, if the
Table 5.1
Dielectric Constants of Common Solvents
Solvent
μ (D)
n
ε(0) at 20°C
Onsager ε (20°C)
Toluene
0.38
1.49
2.38
2.40
Diethyl ether
1.10
1.35
4.27
3.19
Dichloromethane
1.60
1.42
8.93
7.88
Acetone
2.88
1.36
21.01
18.28
Acetonitrile
3.93
1.34
36.64
44.95
Water
1.85
1.33
80.1
28.90*
Source: Data from Haynes, W.N., ed. CRC Handbook of Chemistry and Physics, 97th Ed., 2017, CRC Press.
* Onsager model does not account for hydrogen bonding.
Ion
q +
q –
q 1 = ze
L
r 12
μ
θ
Figure 5.4 A schematic depiction of the variables involved in an ion–dipole
interaction. L is the distance between the centers of the two partial charges of the
dipole. r 12 is the distance between the center of the ion and the midpoint of L. θ is the
angle between L and r 12 . q 1 is the charge on the ion, calculated as ze. µ is the dipole
moment.
INTERMOLECULAR FORCES AND SELF-ASSEMBLY 139