

3 PAIRING COAL WITH SOLAR: THE UAE’S FRAGMENTED …
63
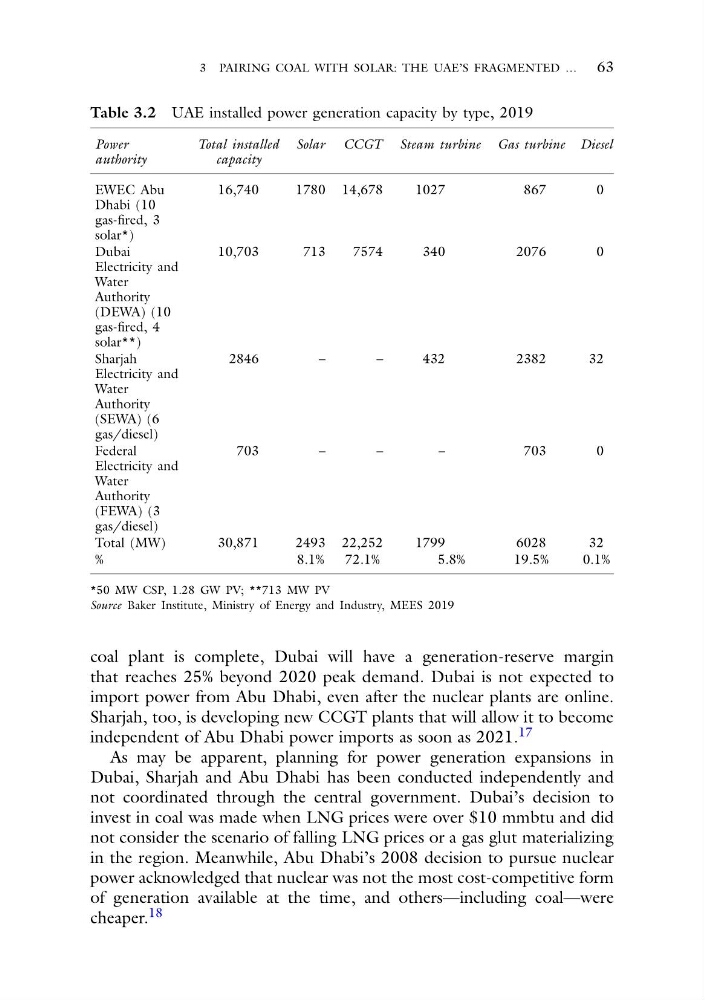
Table 3.2 UAE installed power generation capacity by type, 2019
Power
authority
Total installed
capacity
Solar CCGT Steam turbine Gas turbine Diesel
EWEC Abu
Dhabi (10
gas-fired, 3
solar*)
16,740
1780 14,678
1027
867
0
Dubai
Electricity and
Water
Authority
(DEWA) (10
gas-fired, 4
solar**)
10,703
713
7574
340
2076
0
Sharjah
Electricity and
Water
Authority
(SEWA) (6
gas/diesel)
2846
–
–
432
2382
32
Federal
Electricity and
Water
Authority
(FEWA) (3
gas/diesel)
703
–
–
–
703
0
Total (MW)
30,871
2493 22,252
1799
6028
32
%
8.1%
72.1%
5.8%
19.5%
0.1%
*50 MW CSP, 1.28 GW PV; **713 MW PV
Source Baker Institute, Ministry of Energy and Industry, MEES 2019
coal plant is complete, Dubai will have a generation-reserve margin
that reaches 25% beyond 2020 peak demand. Dubai is not expected to
import power from Abu Dhabi, even after the nuclear plants are online.
Sharjah, too, is developing new CCGT plants that will allow it to become
independent of Abu Dhabi power imports as soon as 2021. 17
As may be apparent, planning for power generation expansions in
Dubai, Sharjah and Abu Dhabi has been conducted independently and
not coordinated through the central government. Dubai’s decision to
invest in coal was made when LNG prices were over $10 mmbtu and did
not consider the scenario of falling LNG prices or a gas glut materializing
in the region. Meanwhile, Abu Dhabi’s 2008 decision to pursue nuclear
power acknowledged that nuclear was not the most cost-competitive form
of generation available at the time, and others—including coal—were
cheaper. 18
63
Table 3.2 UAE installed power generation capacity by type, 2019
Power
authority
Total installed
capacity
Solar CCGT Steam turbine Gas turbine Diesel
EWEC Abu
Dhabi (10
gas-fired, 3
solar*)
16,740
1780 14,678
1027
867
0
Dubai
Electricity and
Water
Authority
(DEWA) (10
gas-fired, 4
solar**)
10,703
713
7574
340
2076
0
Sharjah
Electricity and
Water
Authority
(SEWA) (6
gas/diesel)
2846
–
–
432
2382
32
Federal
Electricity and
Water
Authority
(FEWA) (3
gas/diesel)
703
–
–
–
703
0
Total (MW)
30,871
2493 22,252
1799
6028
32
%
8.1%
72.1%
5.8%
19.5%
0.1%
*50 MW CSP, 1.28 GW PV; **713 MW PV
Source Baker Institute, Ministry of Energy and Industry, MEES 2019
coal plant is complete, Dubai will have a generation-reserve margin
that reaches 25% beyond 2020 peak demand. Dubai is not expected to
import power from Abu Dhabi, even after the nuclear plants are online.
Sharjah, too, is developing new CCGT plants that will allow it to become
independent of Abu Dhabi power imports as soon as 2021. 17
As may be apparent, planning for power generation expansions in
Dubai, Sharjah and Abu Dhabi has been conducted independently and
not coordinated through the central government. Dubai’s decision to
invest in coal was made when LNG prices were over $10 mmbtu and did
not consider the scenario of falling LNG prices or a gas glut materializing
in the region. Meanwhile, Abu Dhabi’s 2008 decision to pursue nuclear
power acknowledged that nuclear was not the most cost-competitive form
of generation available at the time, and others—including coal—were
cheaper. 18