

8 L.-C. SIM AND R. MILLS
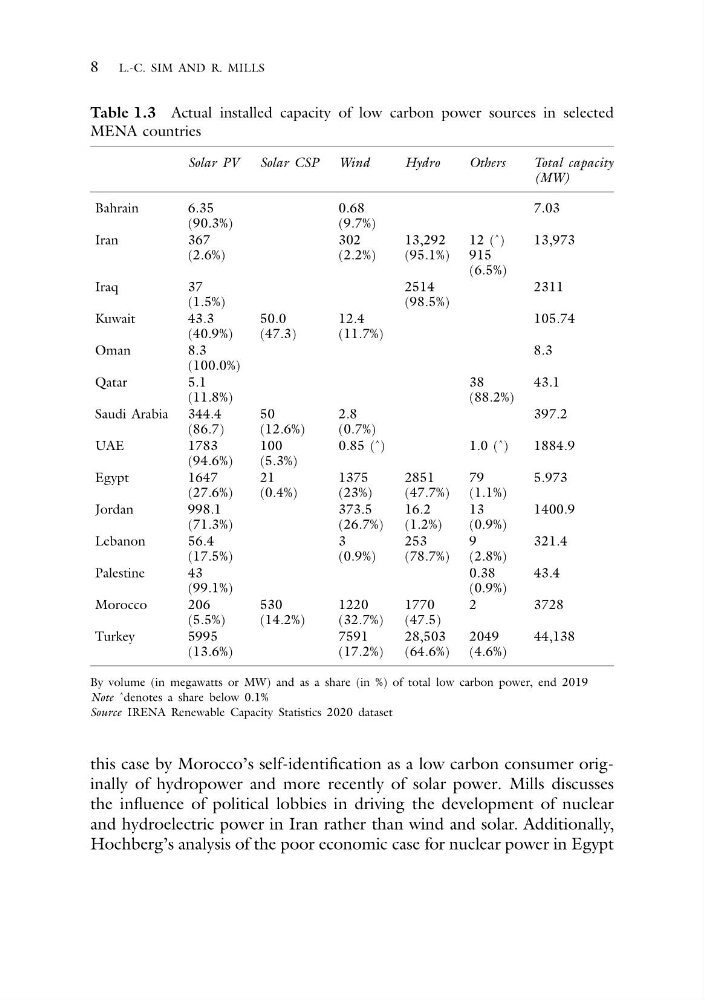
Table 1.3 Actual installed capacity of low carbon power sources in selected
MENA countries
Solar PV
Solar CSP
Wind
Hydro
Others
Total capacity
(MW)
Bahrain
6.35
(90.3%)
0.68
(9.7%)
7.03
Iran
367
(2.6%)
302
(2.2%)
13,292
(95.1%)
12 (ˆ)
915
(6.5%)
13,973
Iraq
37
(1.5%)
2514
(98.5%)
2311
Kuwait
43.3
(40.9%)
50.0
(47.3)
12.4
(11.7%)
105.74
Oman
8.3
(100.0%)
8.3
Qatar
5.1
(11.8%)
38
(88.2%)
43.1
Saudi Arabia 344.4
(86.7)
50
(12.6%)
2.8
(0.7%)
397.2
UAE
1783
(94.6%)
100
(5.3%)
0.85 (ˆ)
1.0 (ˆ)
1884.9
Egypt
1647
(27.6%)
21
(0.4%)
1375
(23%)
2851
(47.7%)
79
(1.1%)
5.973
Jordan
998.1
(71.3%)
373.5
(26.7%)
16.2
(1.2%)
13
(0.9%)
1400.9
Lebanon
56.4
(17.5%)
3
(0.9%)
253
(78.7%)
9
(2.8%)
321.4
Palestine
43
(99.1%)
0.38
(0.9%)
43.4
Morocco
206
(5.5%)
530
(14.2%)
1220
(32.7%)
1770
(47.5)
2
3728
Turkey
5995
(13.6%)
7591
(17.2%)
28,503
(64.6%)
2049
(4.6%)
44,138
By volume (in megawatts or MW) and as a share (in %) of total low carbon power, end 2019
Note ˆdenotes a share below 0.1%
Source IRENA Renewable Capacity Statistics 2020 dataset
this case by Morocco’s self-identification as a low carbon consumer originally of hydropower and more recently of solar power. Mills discusses
the influence of political lobbies in driving the development of nuclear
and hydroelectric power in Iran rather than wind and solar. Additionally,
Hochberg’s analysis of the poor economic case for nuclear power in Egypt
Table 1.3 Actual installed capacity of low carbon power sources in selected
MENA countries
Solar PV
Solar CSP
Wind
Hydro
Others
Total capacity
(MW)
Bahrain
6.35
(90.3%)
0.68
(9.7%)
7.03
Iran
367
(2.6%)
302
(2.2%)
13,292
(95.1%)
12 (ˆ)
915
(6.5%)
13,973
Iraq
37
(1.5%)
2514
(98.5%)
2311
Kuwait
43.3
(40.9%)
50.0
(47.3)
12.4
(11.7%)
105.74
Oman
8.3
(100.0%)
8.3
Qatar
5.1
(11.8%)
38
(88.2%)
43.1
Saudi Arabia 344.4
(86.7)
50
(12.6%)
2.8
(0.7%)
397.2
UAE
1783
(94.6%)
100
(5.3%)
0.85 (ˆ)
1.0 (ˆ)
1884.9
Egypt
1647
(27.6%)
21
(0.4%)
1375
(23%)
2851
(47.7%)
79
(1.1%)
5.973
Jordan
998.1
(71.3%)
373.5
(26.7%)
16.2
(1.2%)
13
(0.9%)
1400.9
Lebanon
56.4
(17.5%)
3
(0.9%)
253
(78.7%)
9
(2.8%)
321.4
Palestine
43
(99.1%)
0.38
(0.9%)
43.4
Morocco
206
(5.5%)
530
(14.2%)
1220
(32.7%)
1770
(47.5)
2
3728
Turkey
5995
(13.6%)
7591
(17.2%)
28,503
(64.6%)
2049
(4.6%)
44,138
By volume (in megawatts or MW) and as a share (in %) of total low carbon power, end 2019
Note ˆdenotes a share below 0.1%
Source IRENA Renewable Capacity Statistics 2020 dataset
this case by Morocco’s self-identification as a low carbon consumer originally of hydropower and more recently of solar power. Mills discusses
the influence of political lobbies in driving the development of nuclear
and hydroelectric power in Iran rather than wind and solar. Additionally,
Hochberg’s analysis of the poor economic case for nuclear power in Egypt